

All analytics
Each card shows the trend of the board’s first chart and its first four numbers, each with its change against the period before. All cards share one period, picked on the right. Click a card, or View details, to open its board on the same period.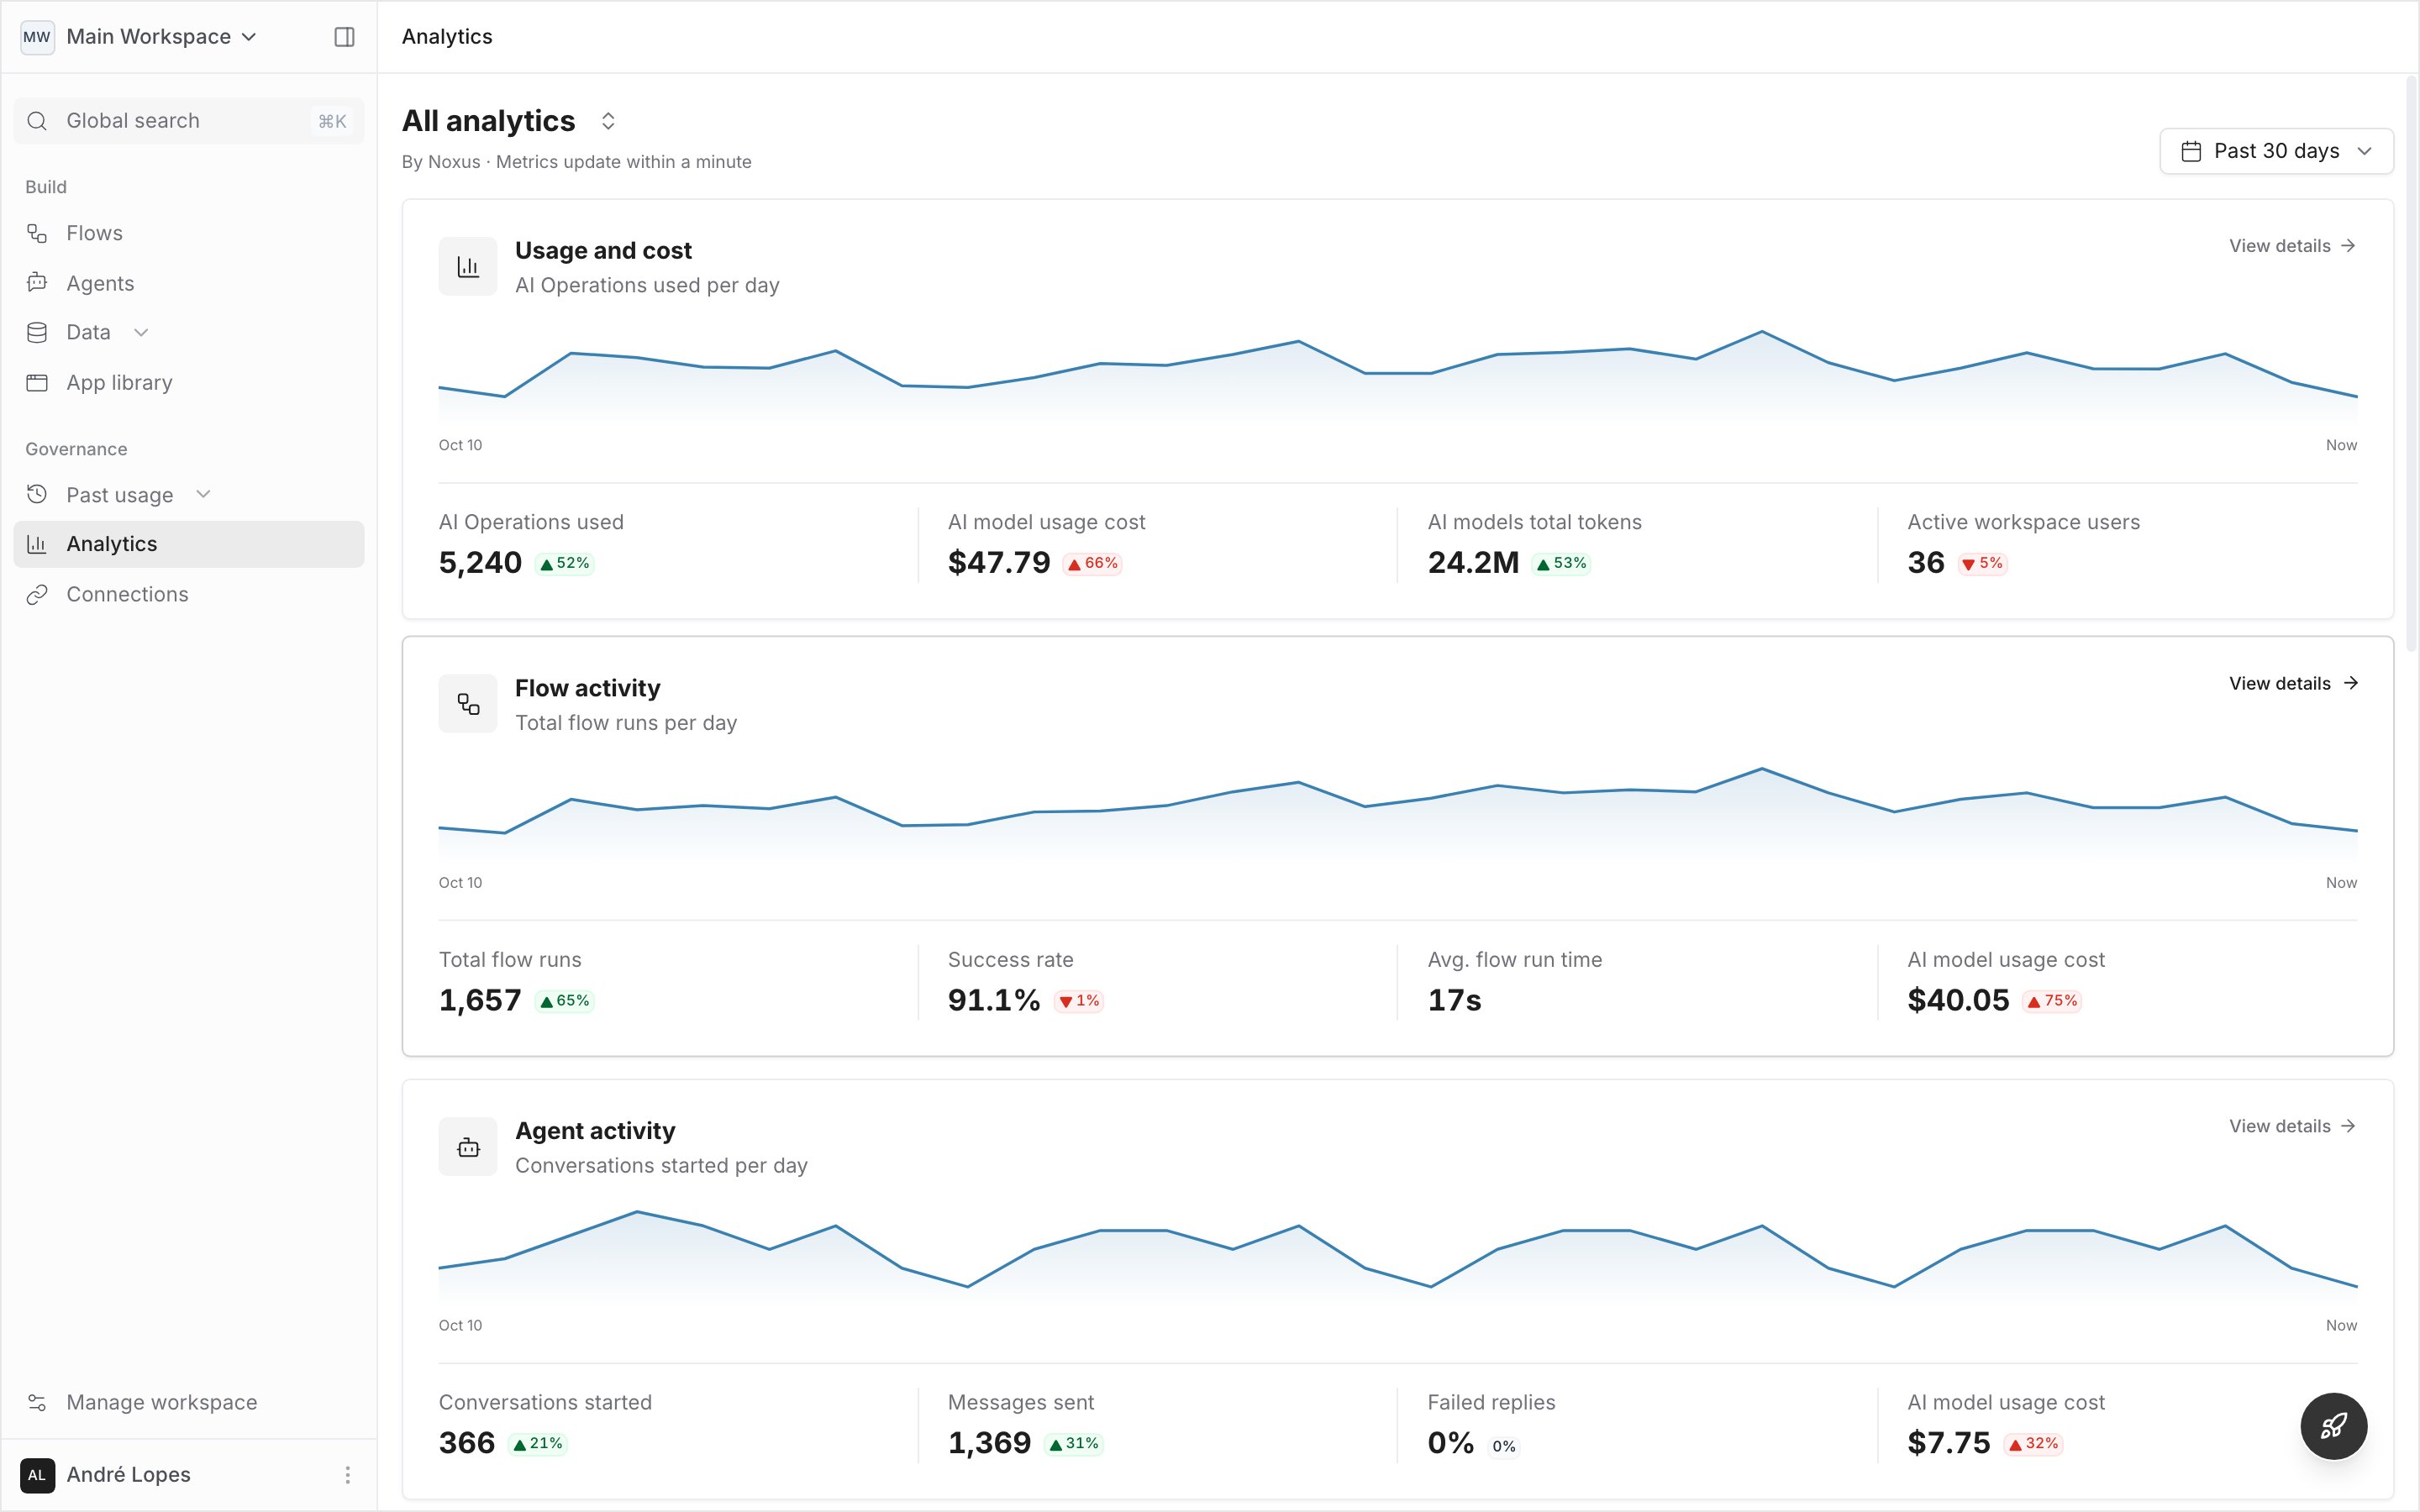
Switching boards
Click the board’s title to list every board, and type to search them by name. All analytics is listed below the boards.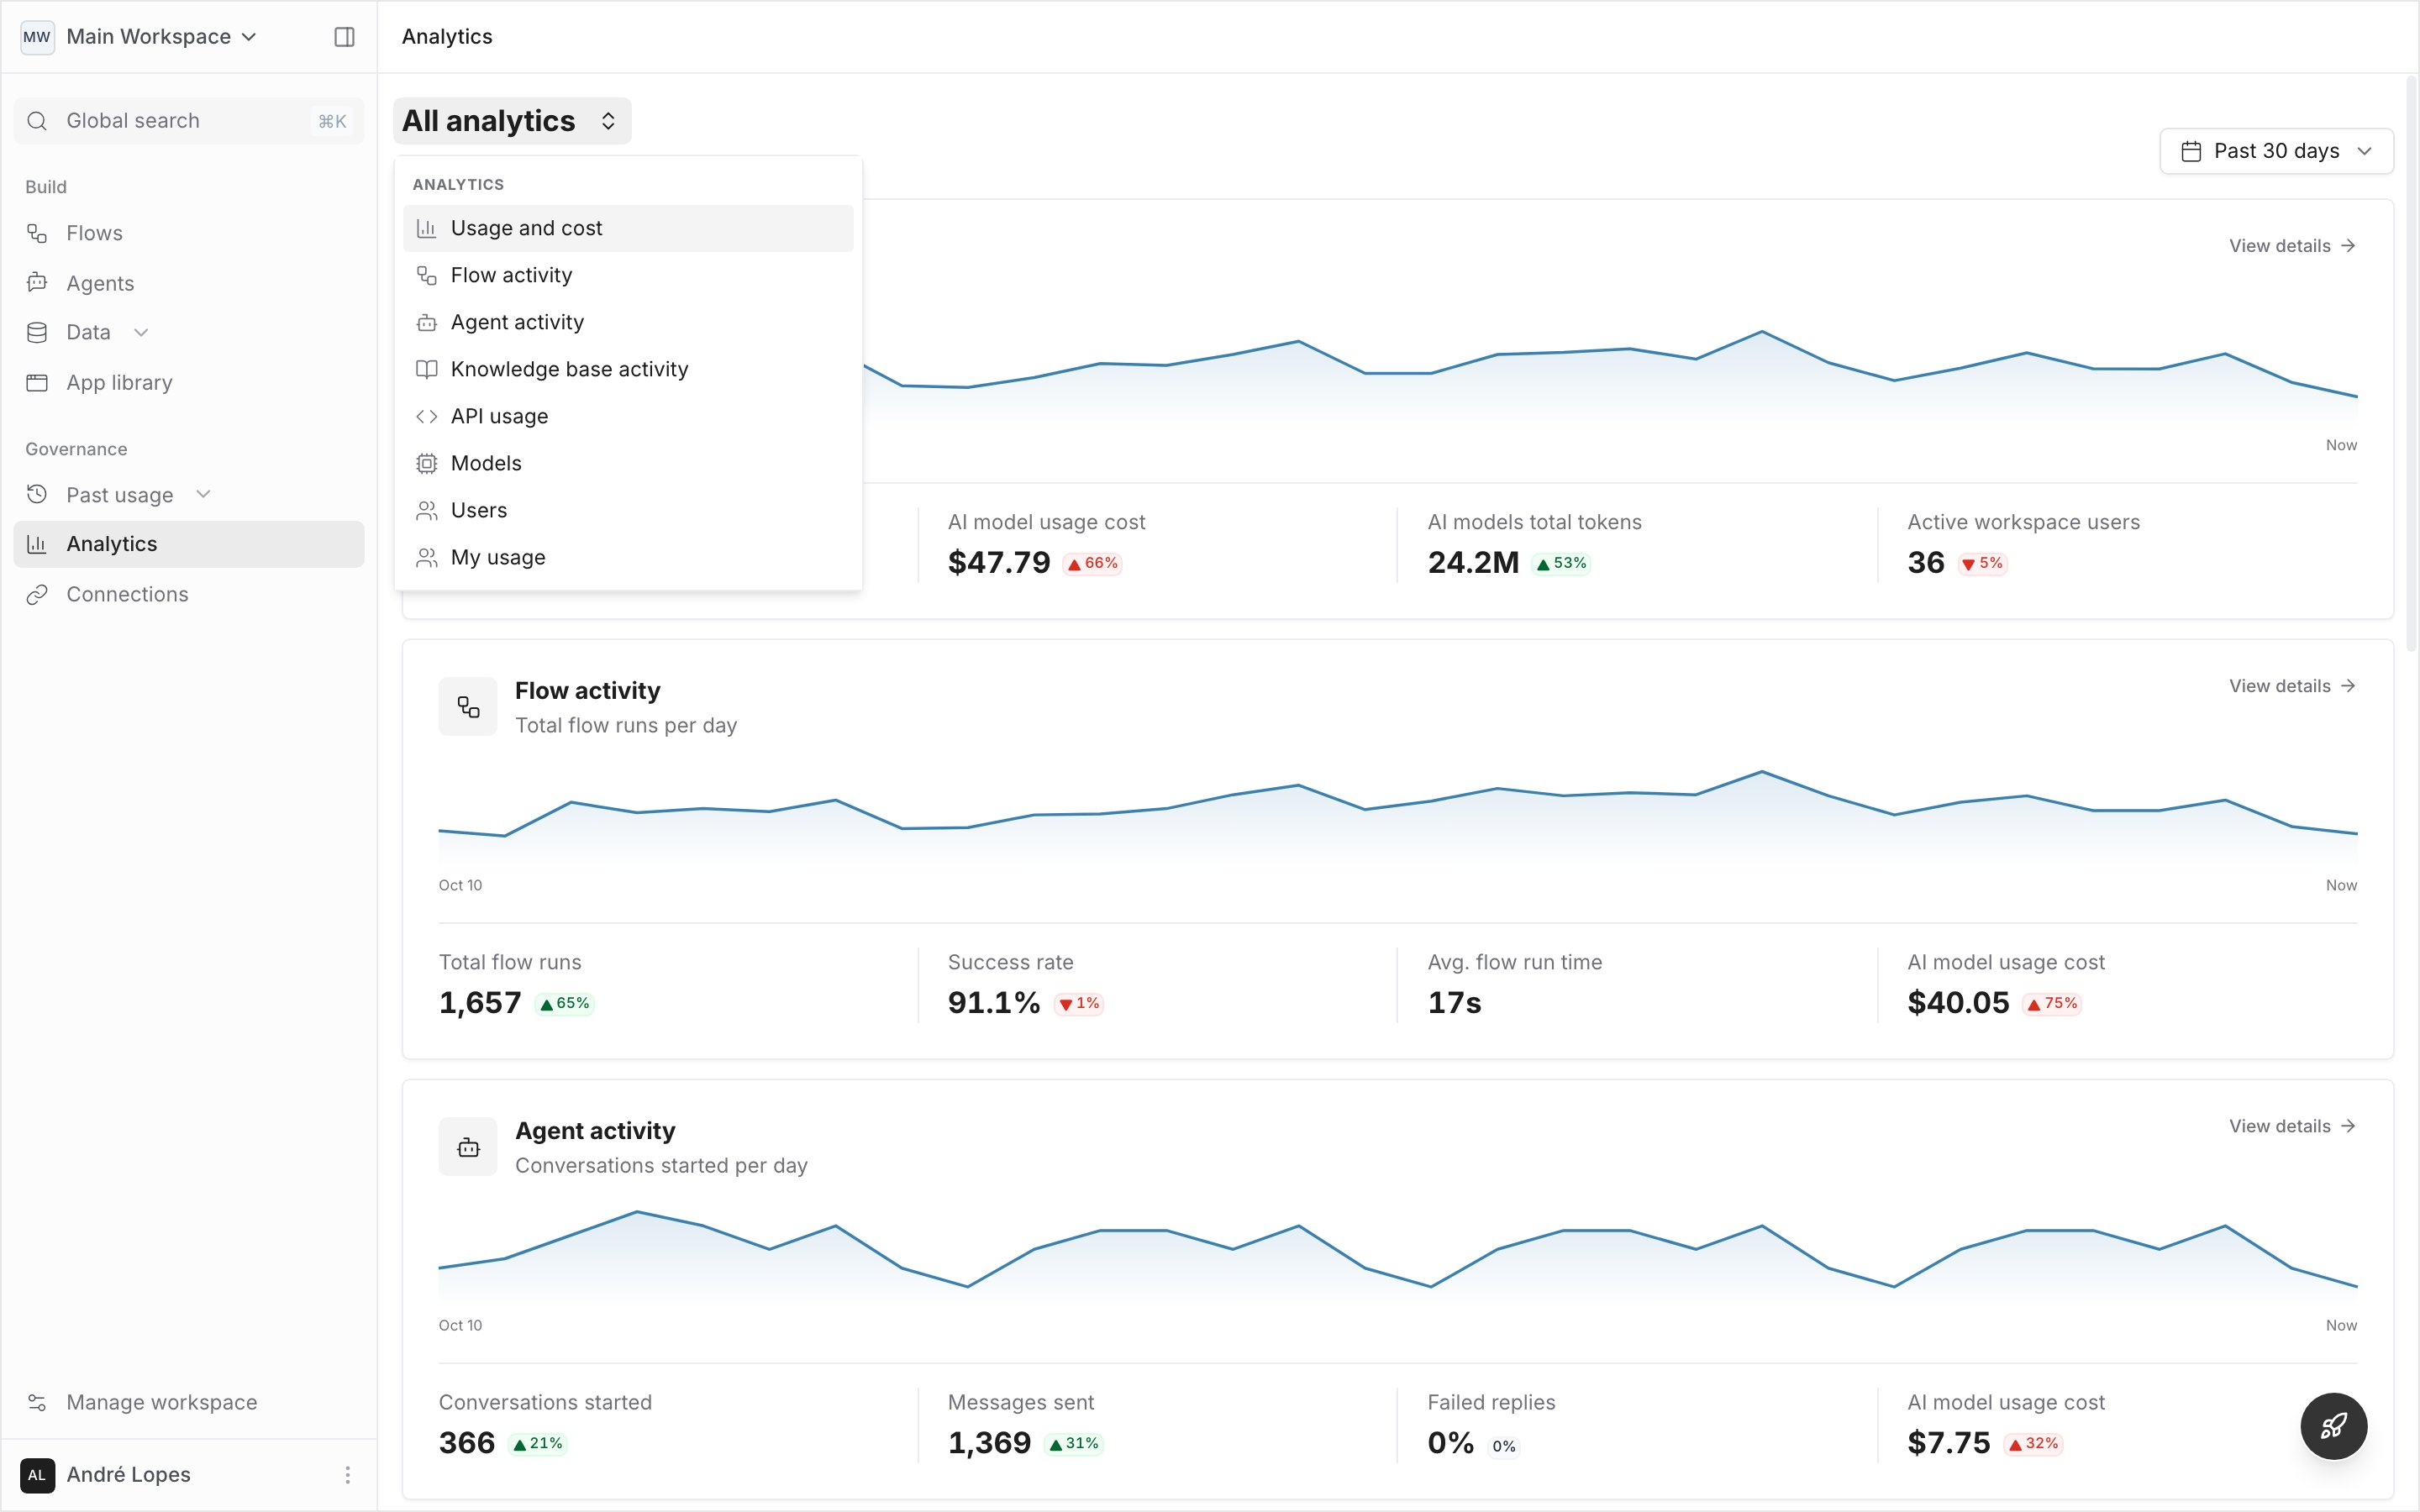
The boards
Every board, and the Analytics tab of every flow, agent and knowledge base, opens on the current billing cycle. Once you pick another period on a board or a flow’s or agent’s tab, the boards and those tabs open on it for the rest of your browser session.- Usage and cost
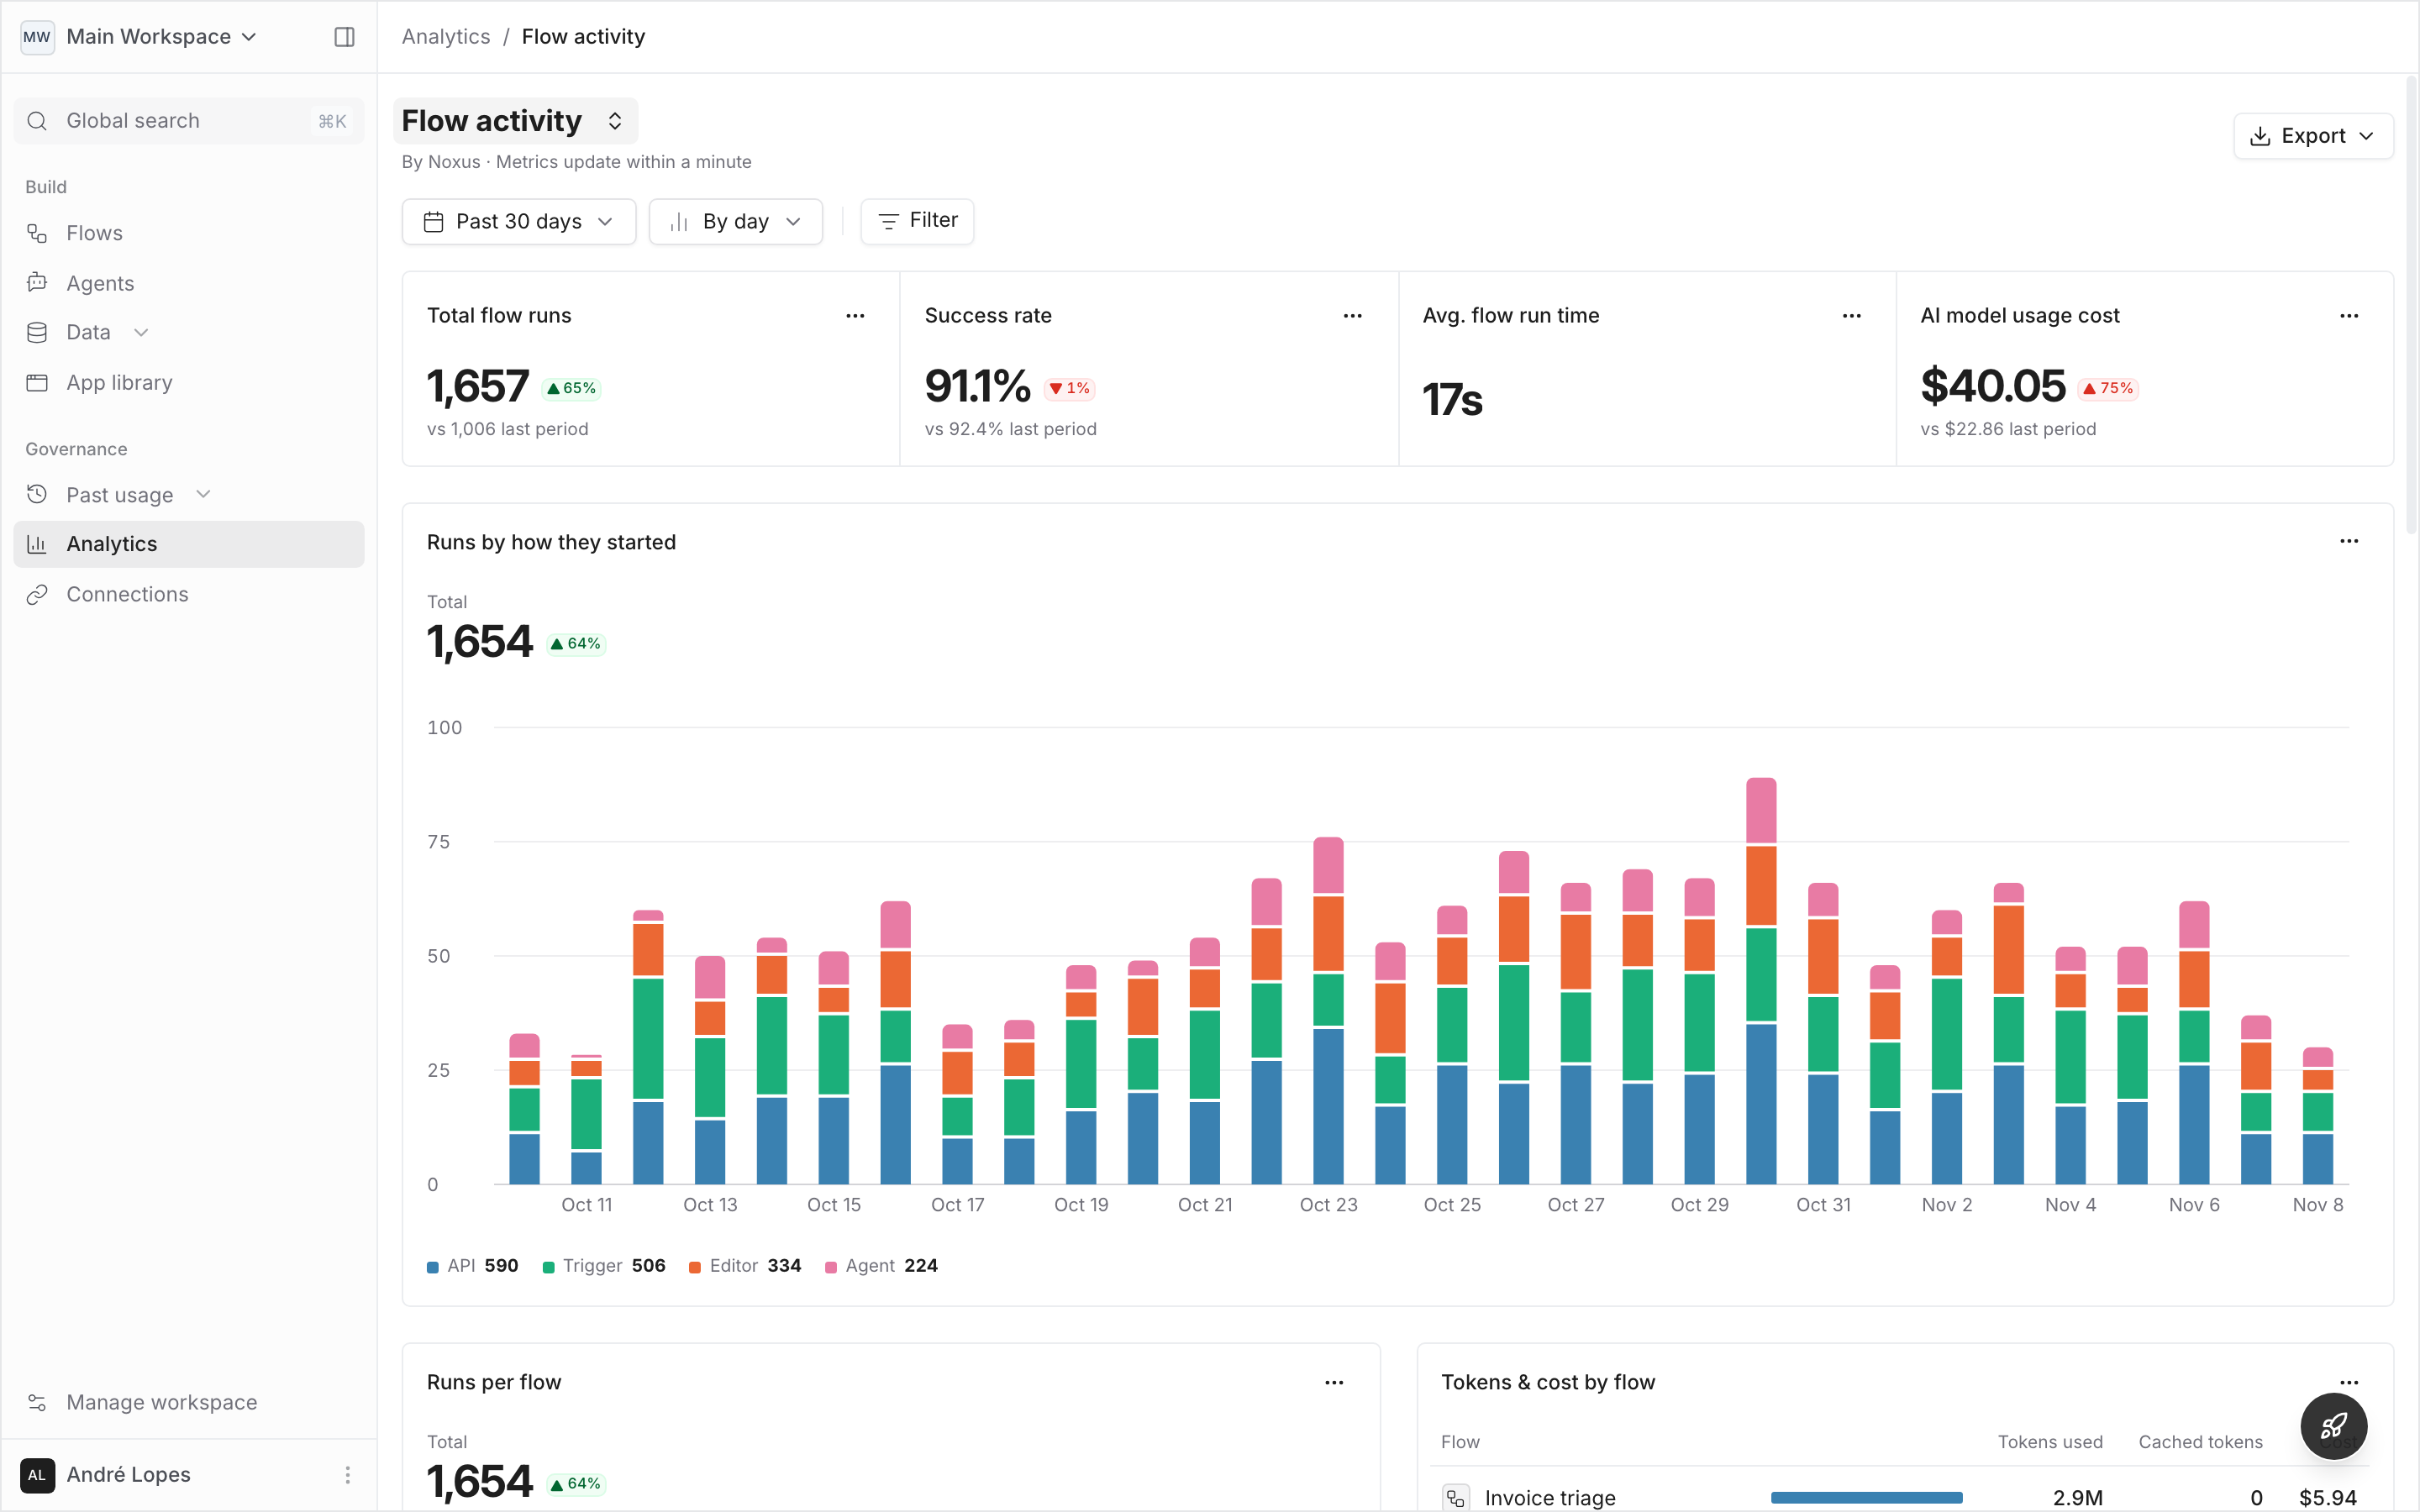
- Flow activity
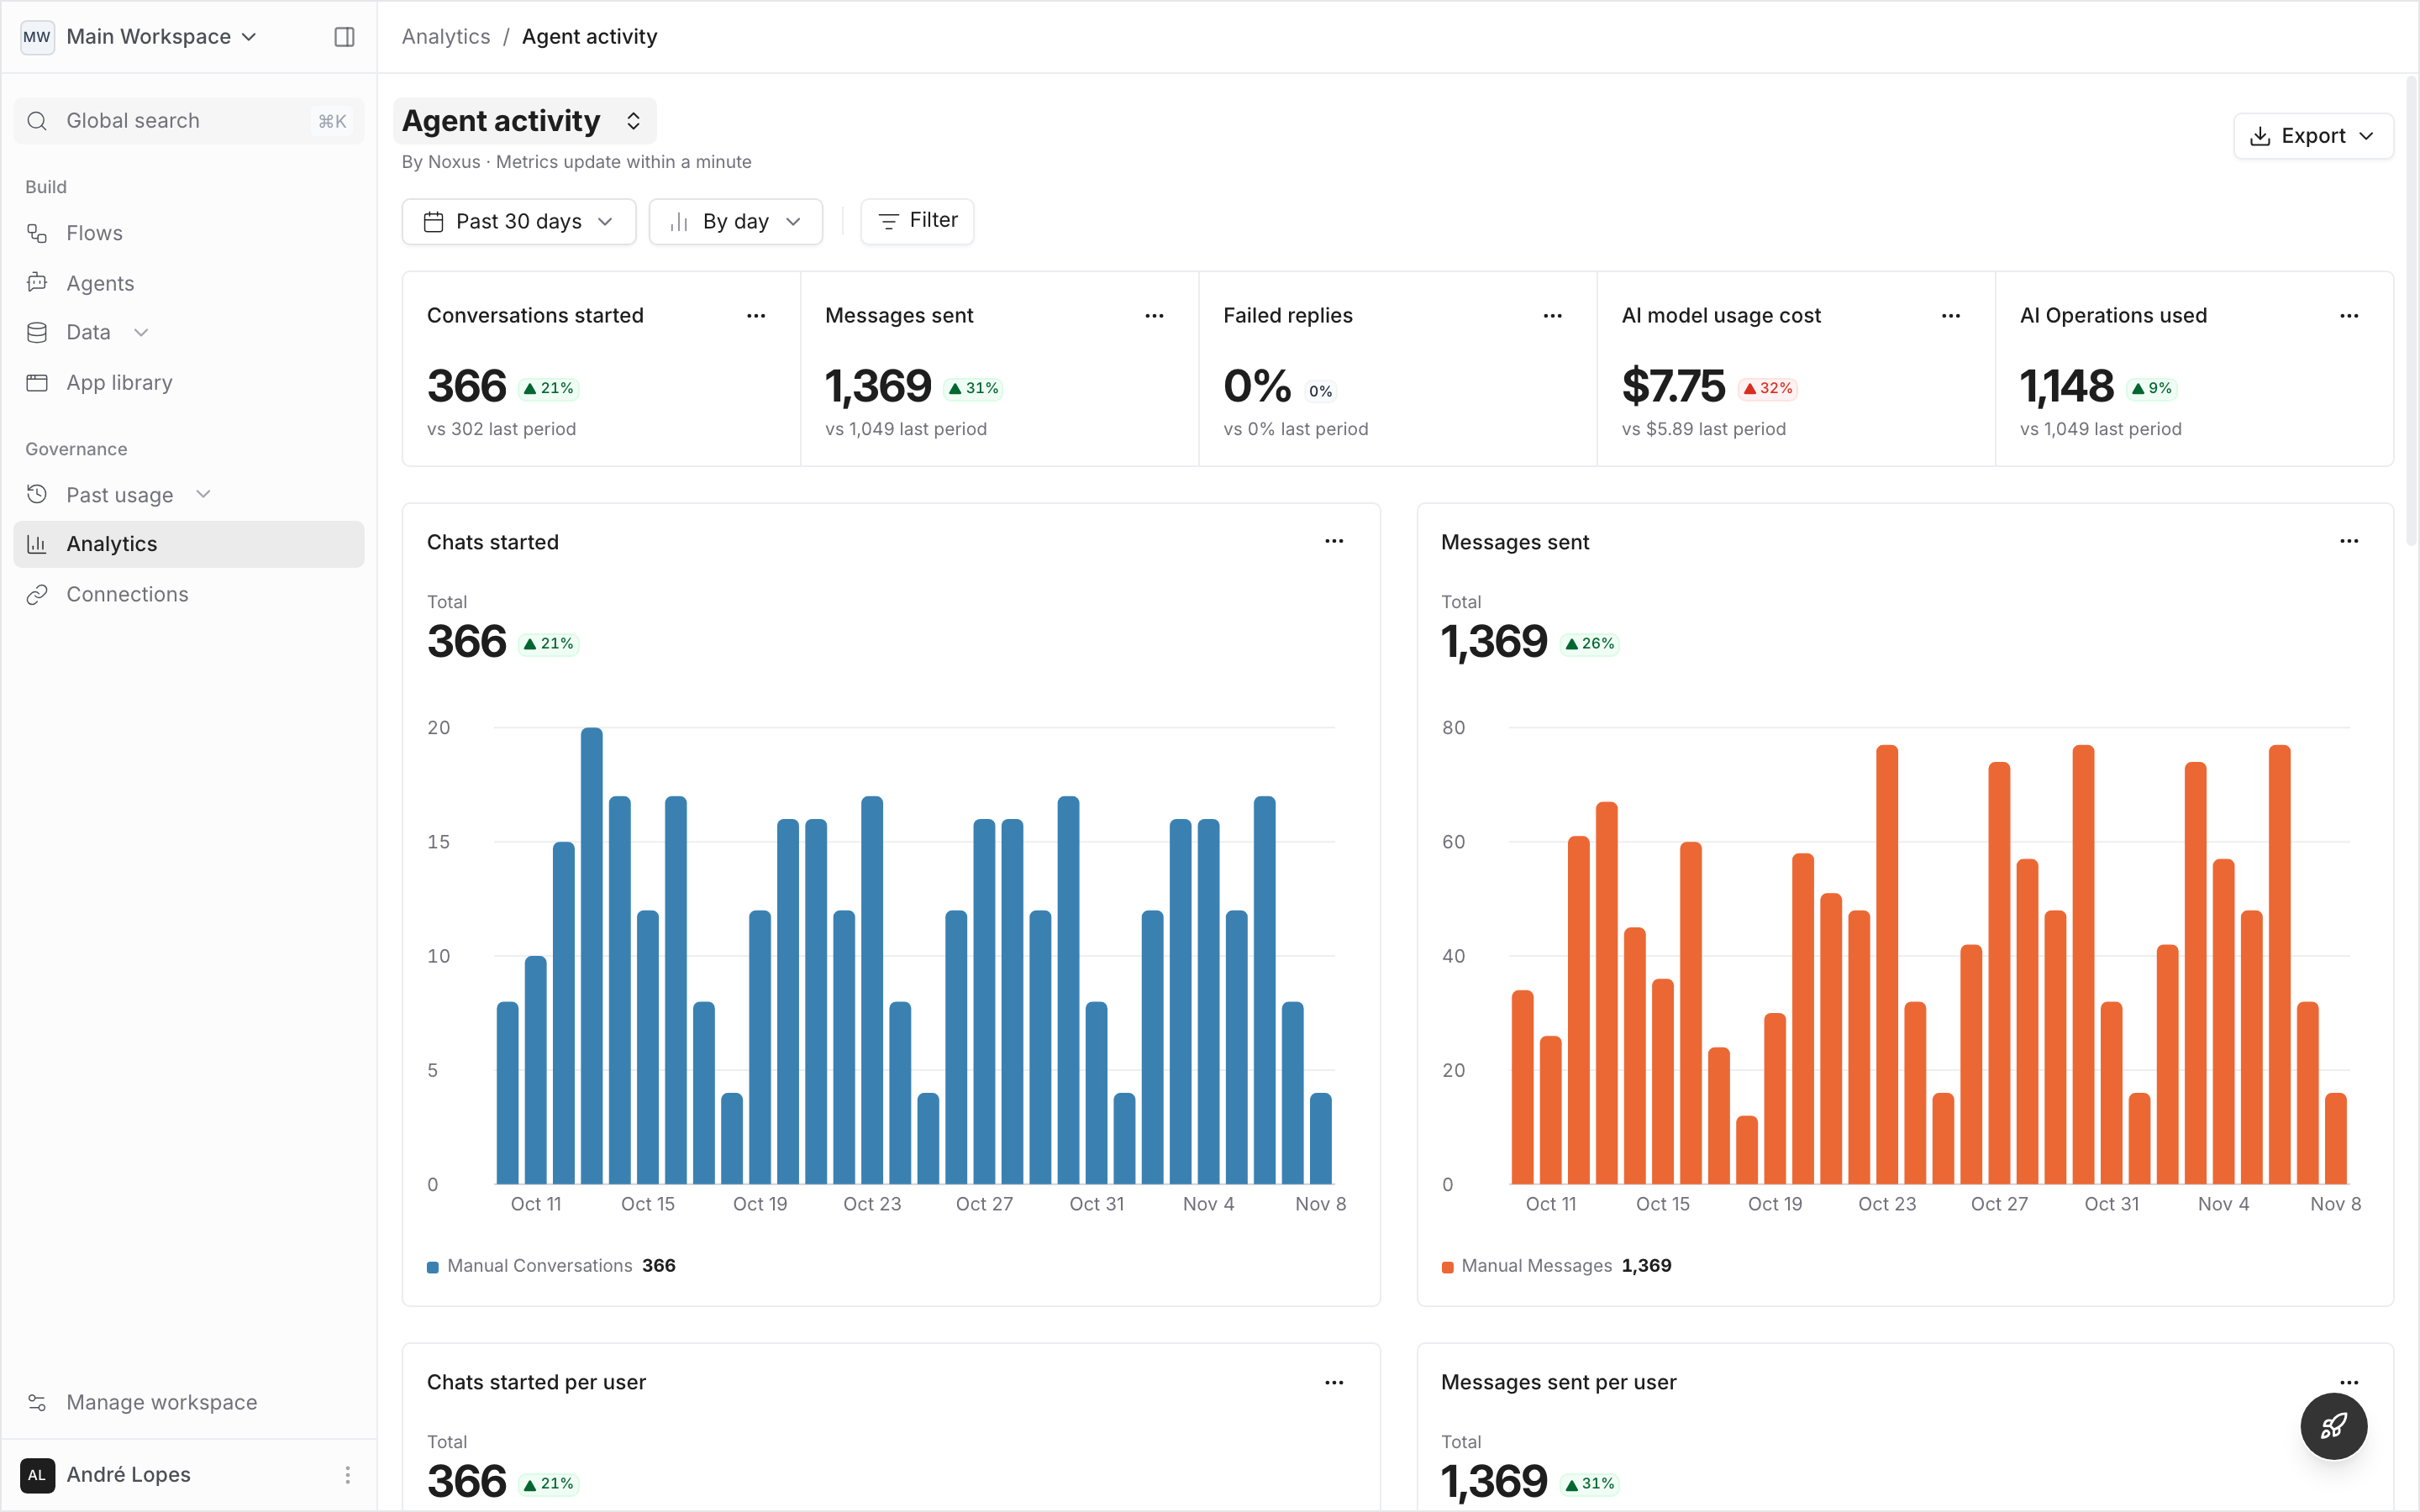
- Agent activity
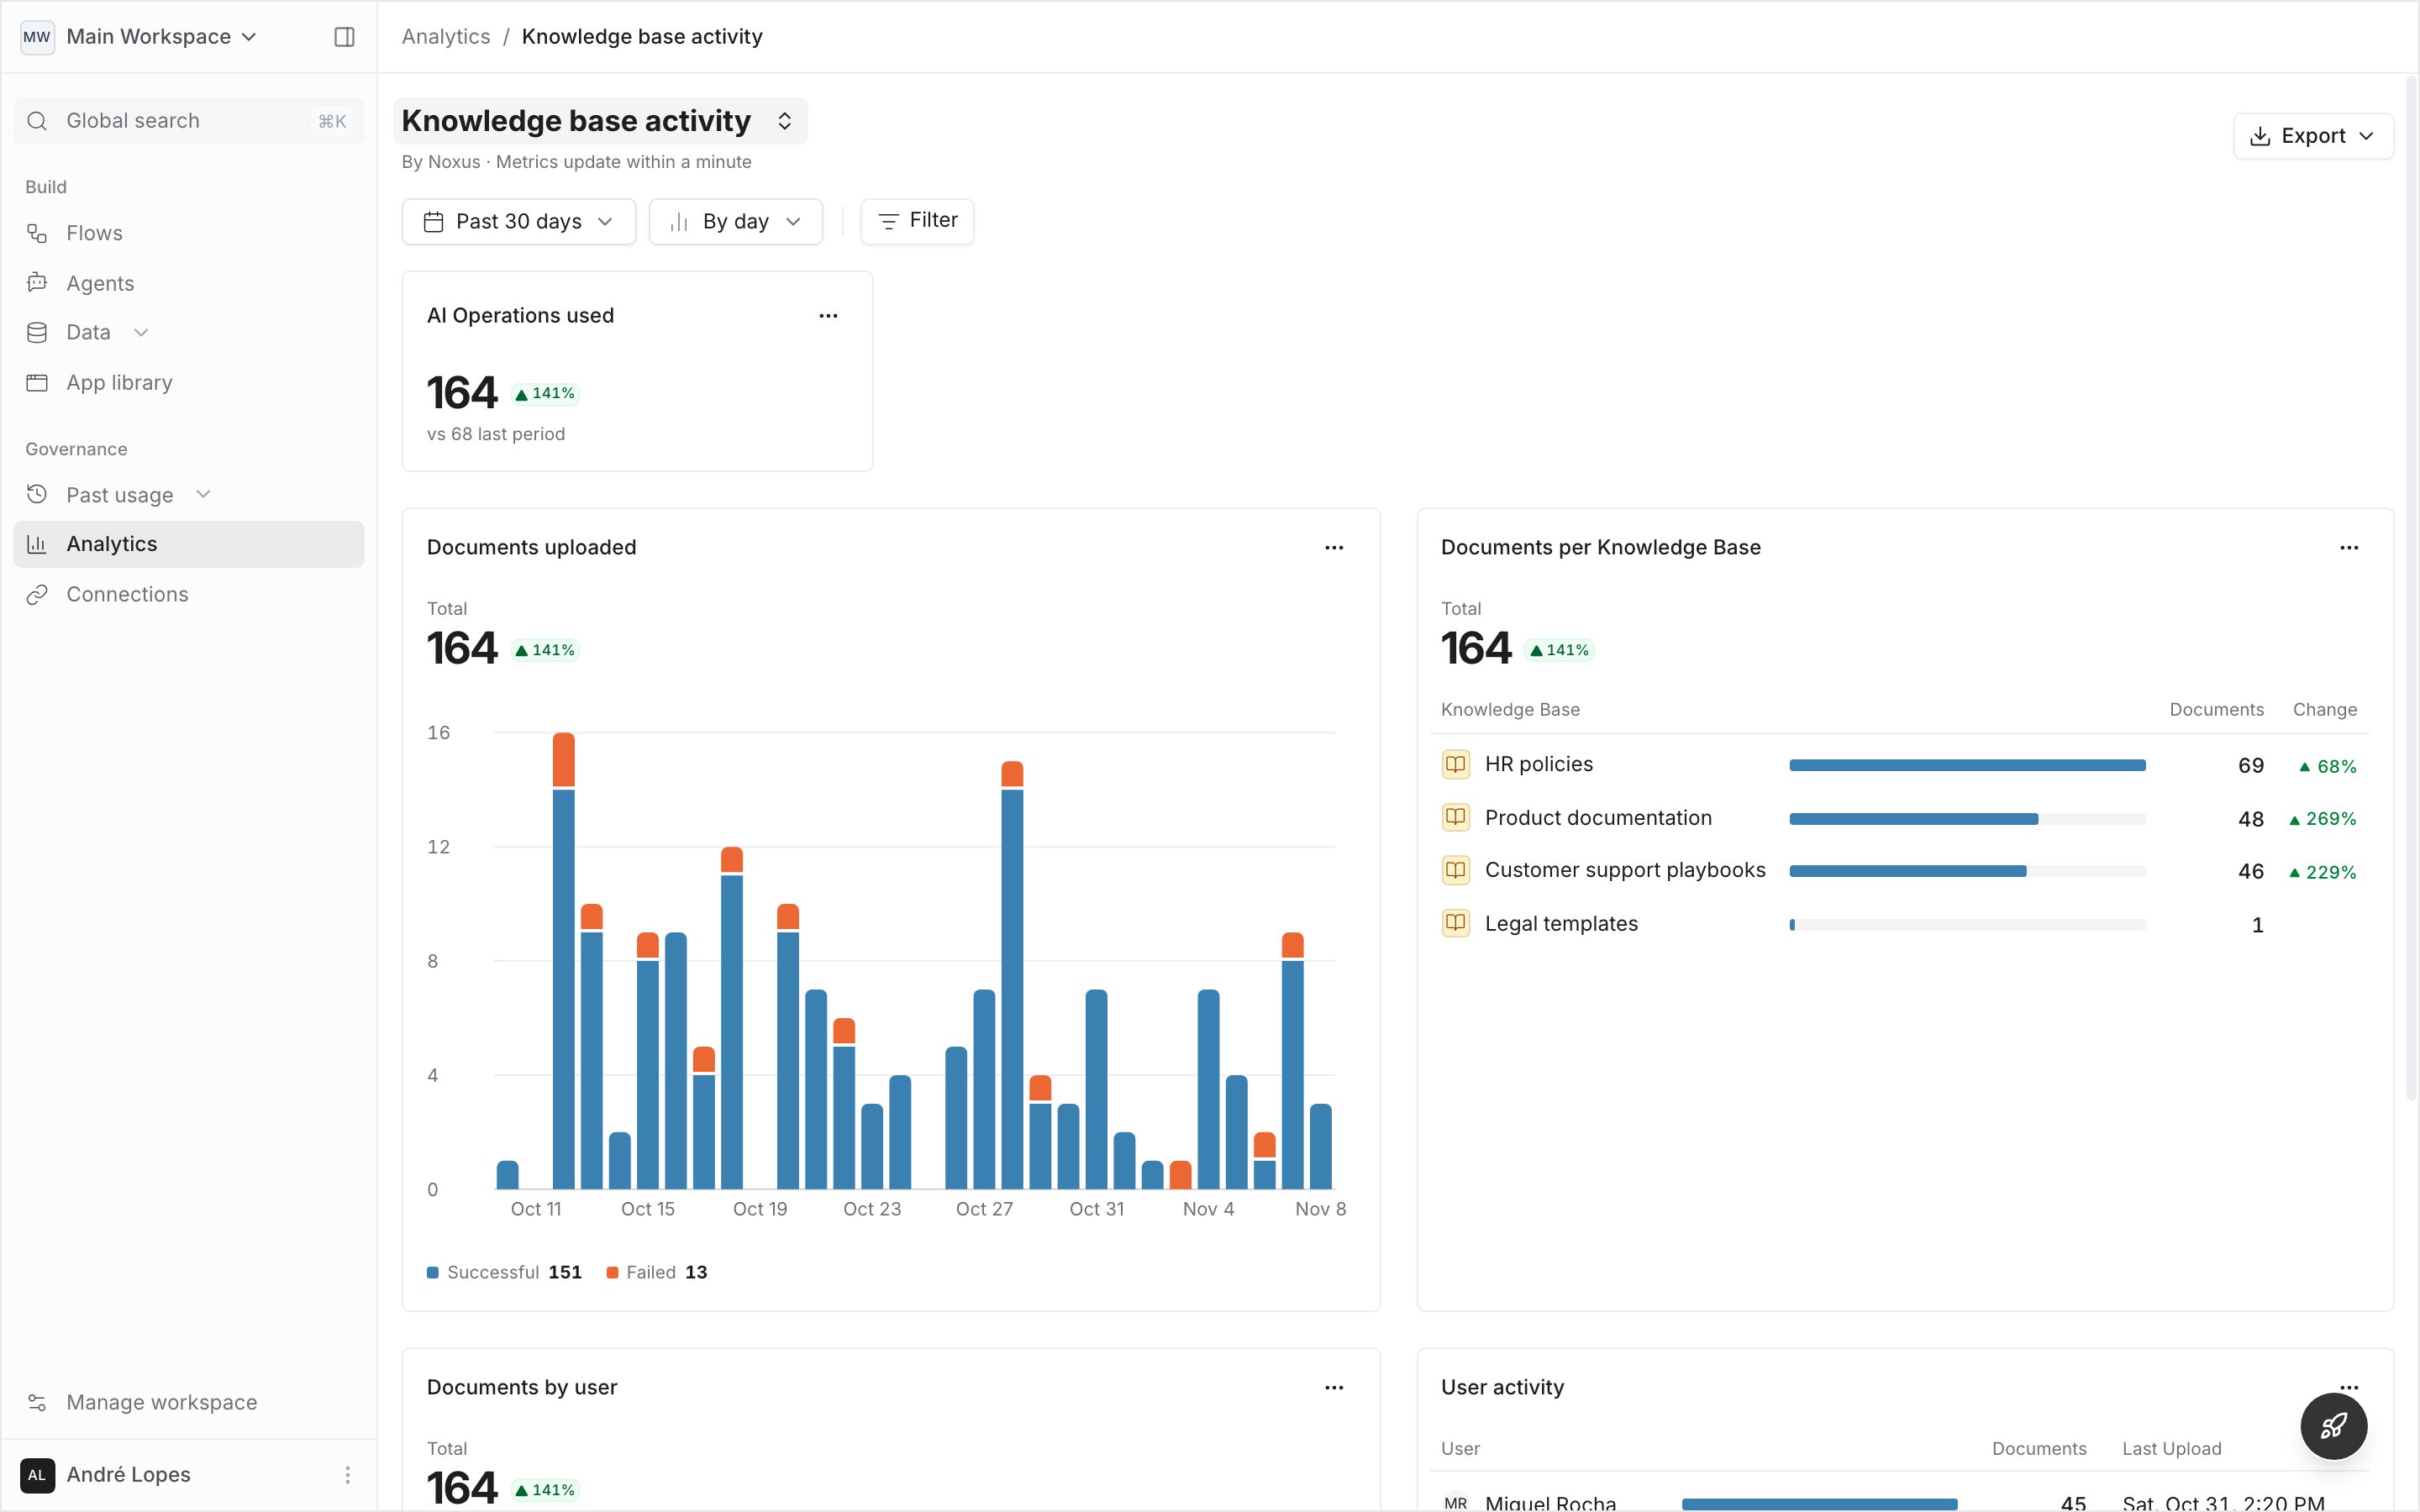
- Knowledge base activity
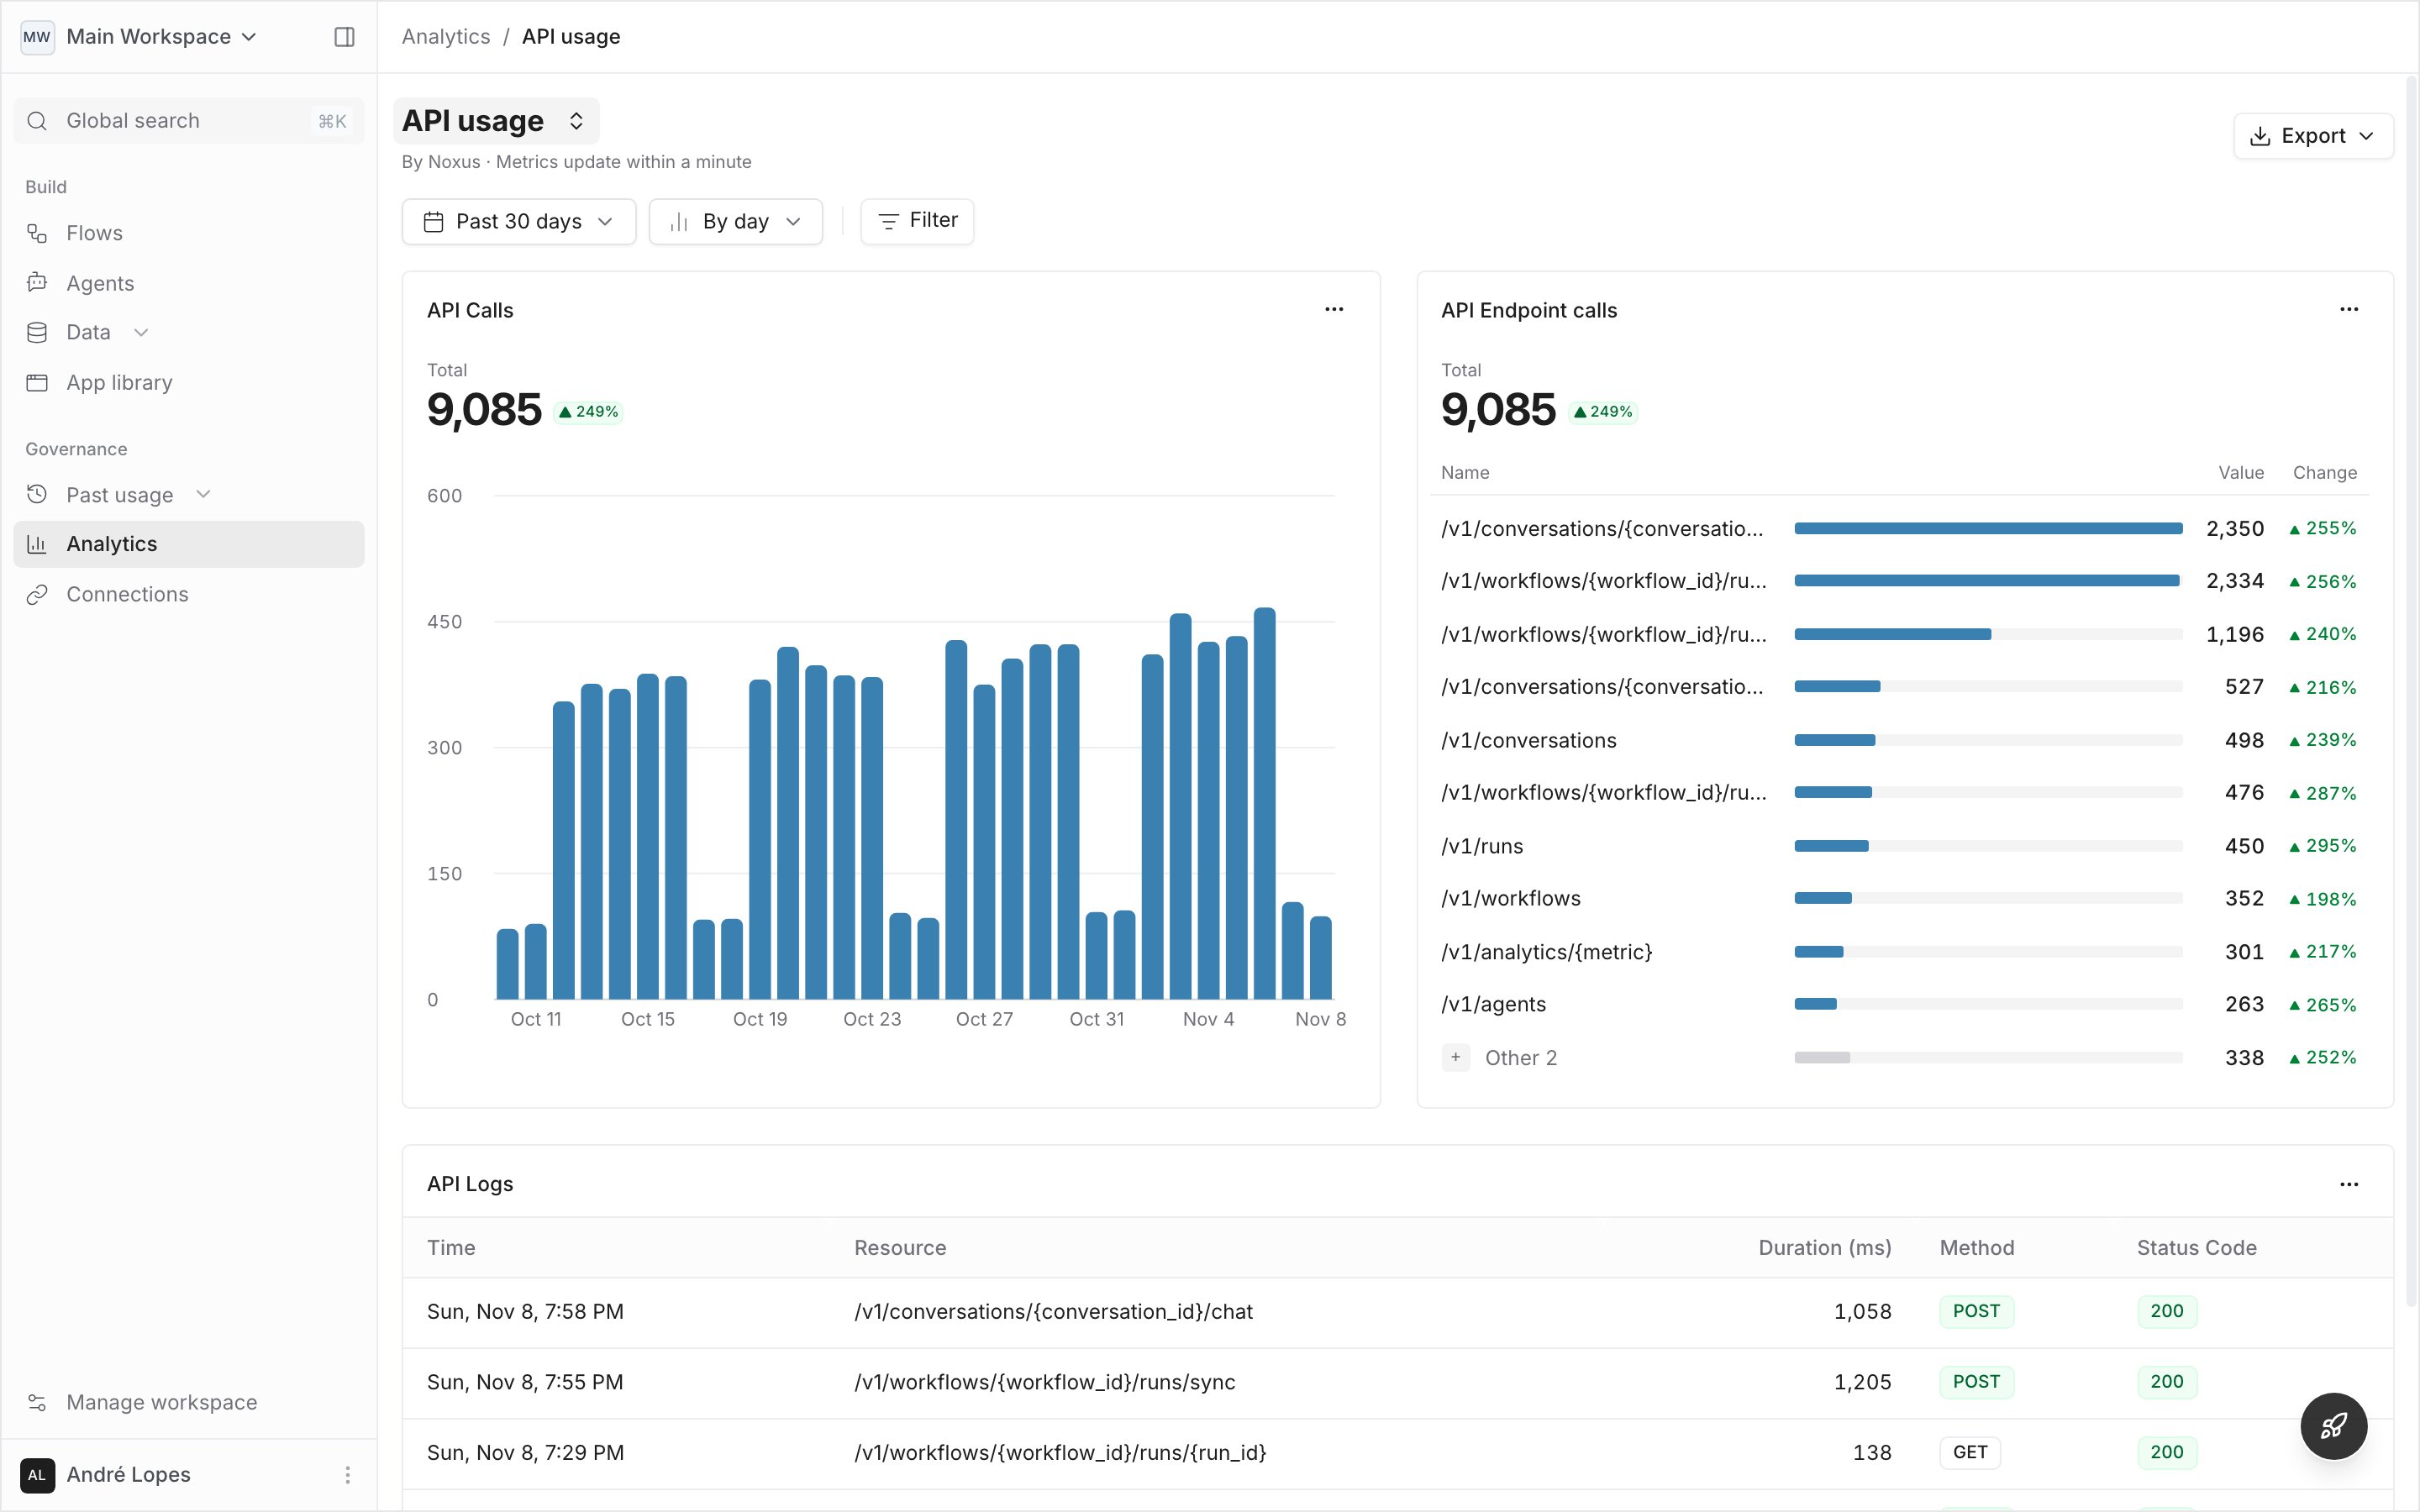
- API usage
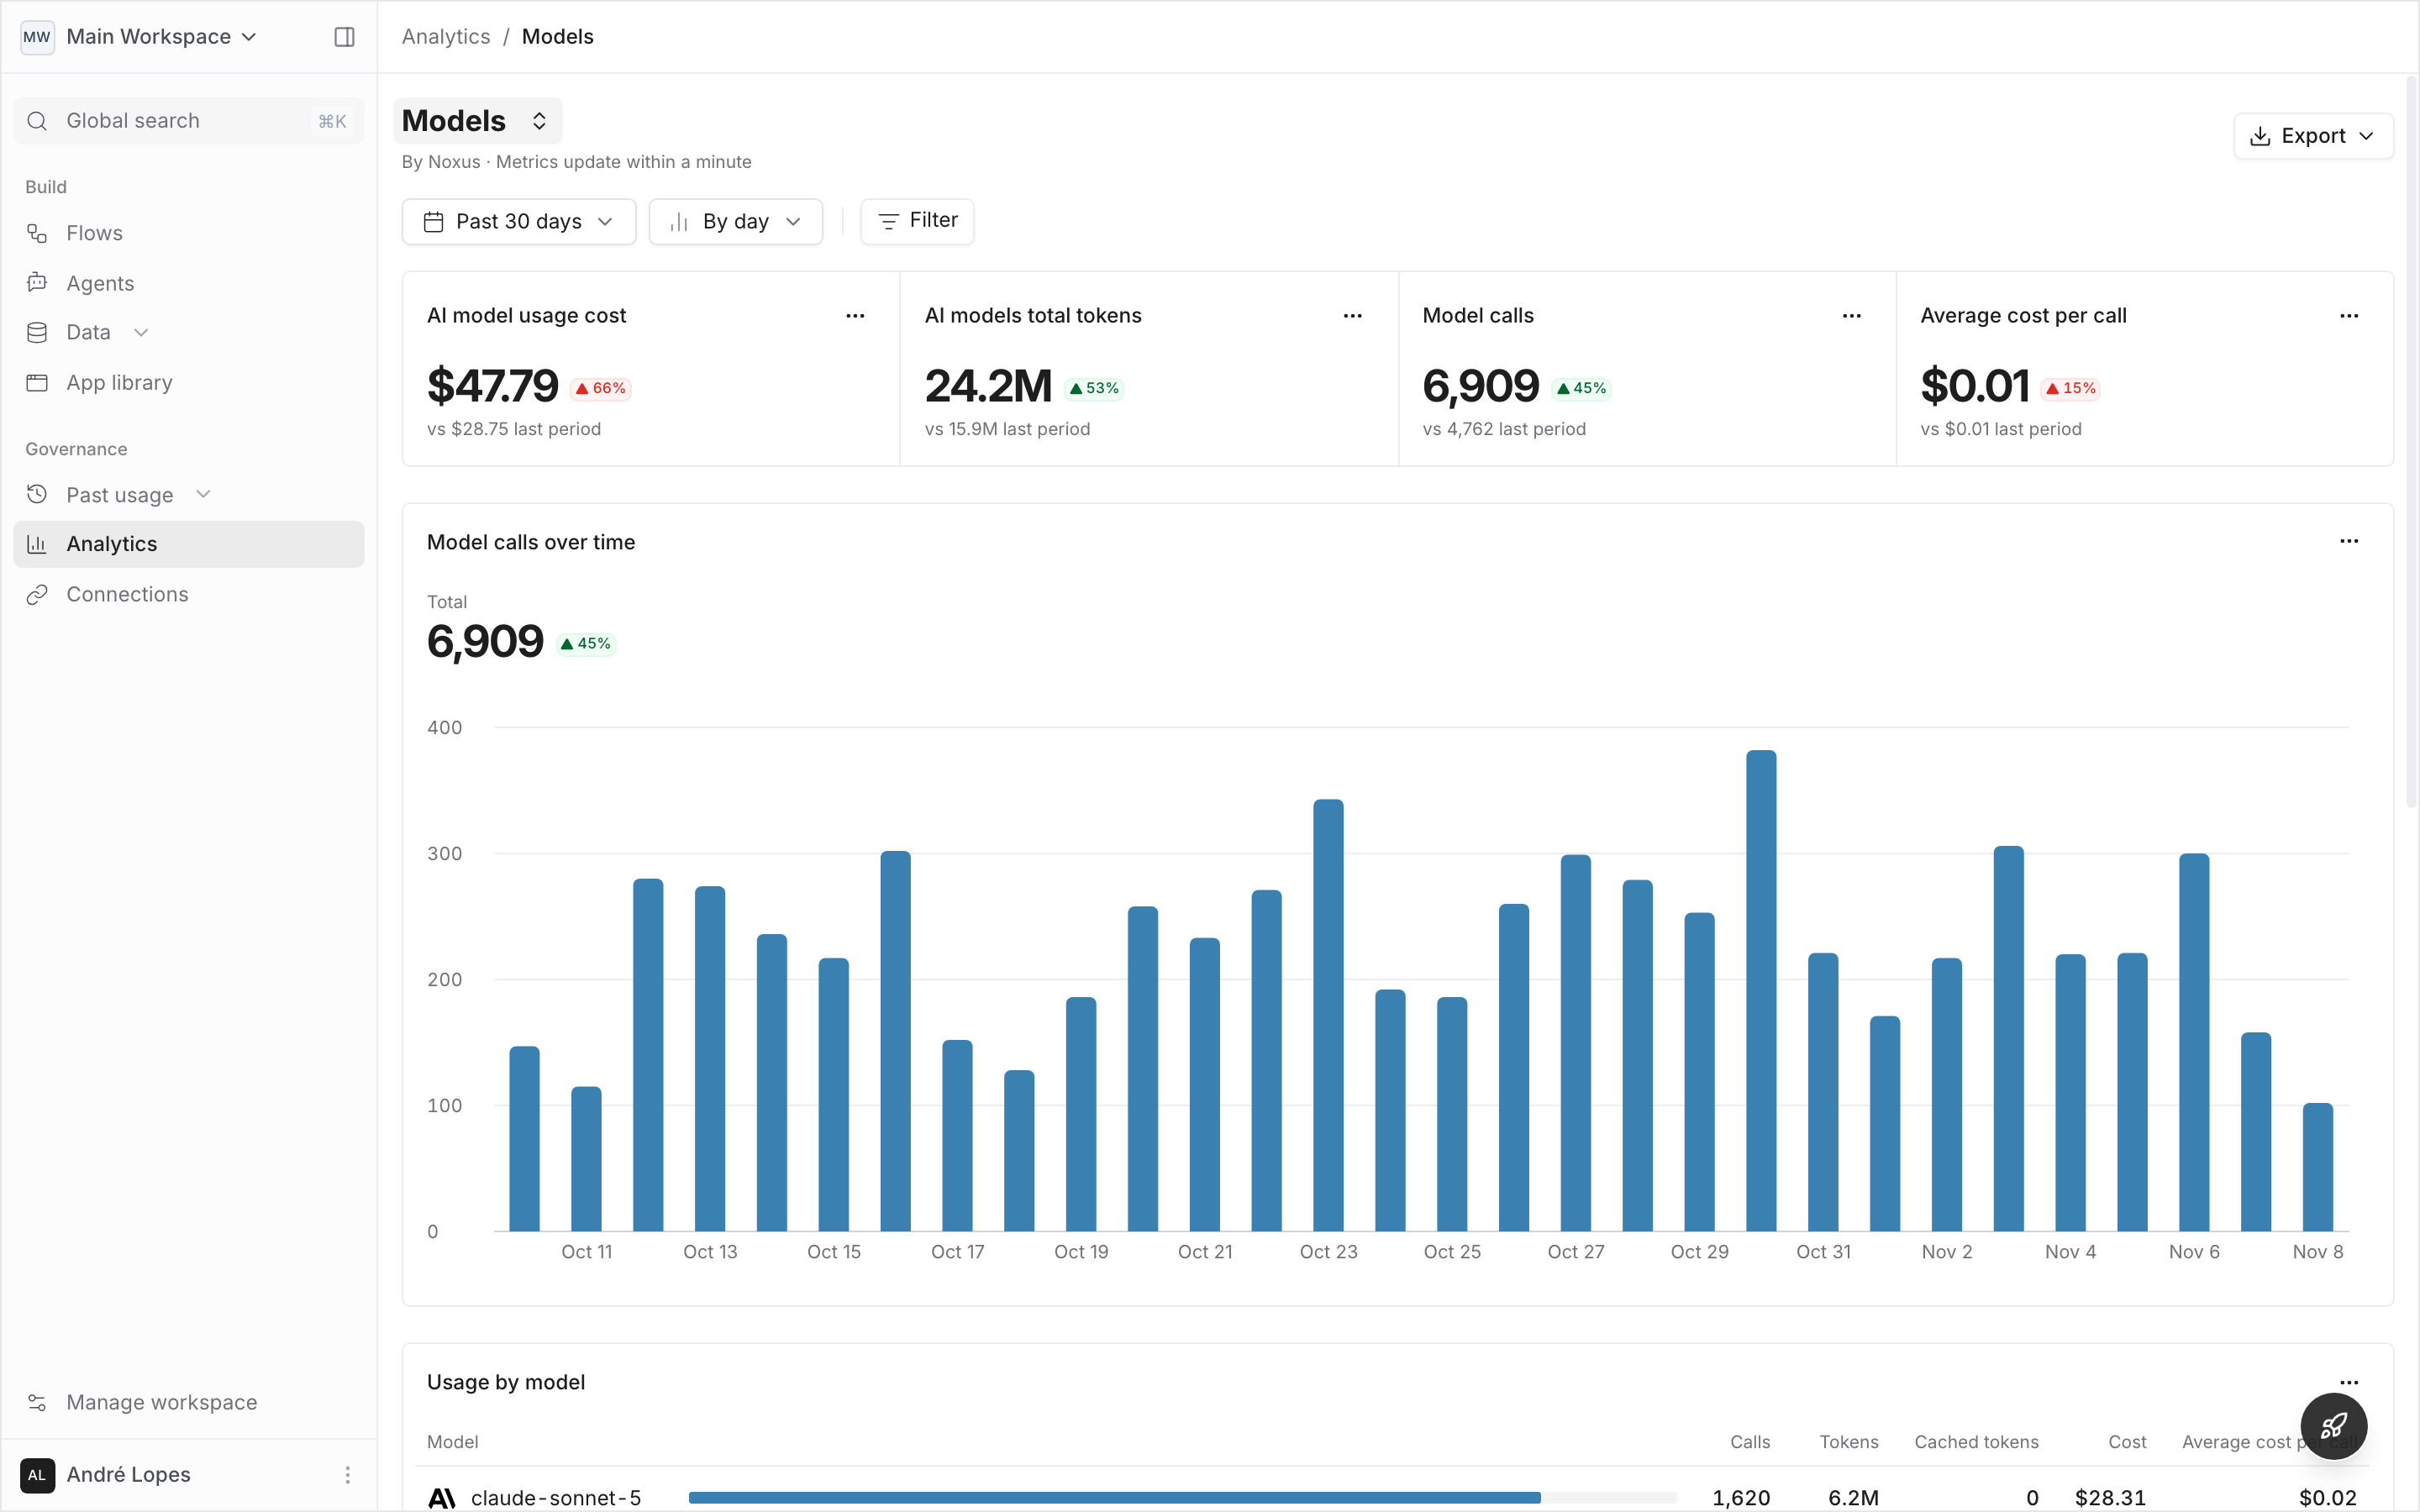
- Models
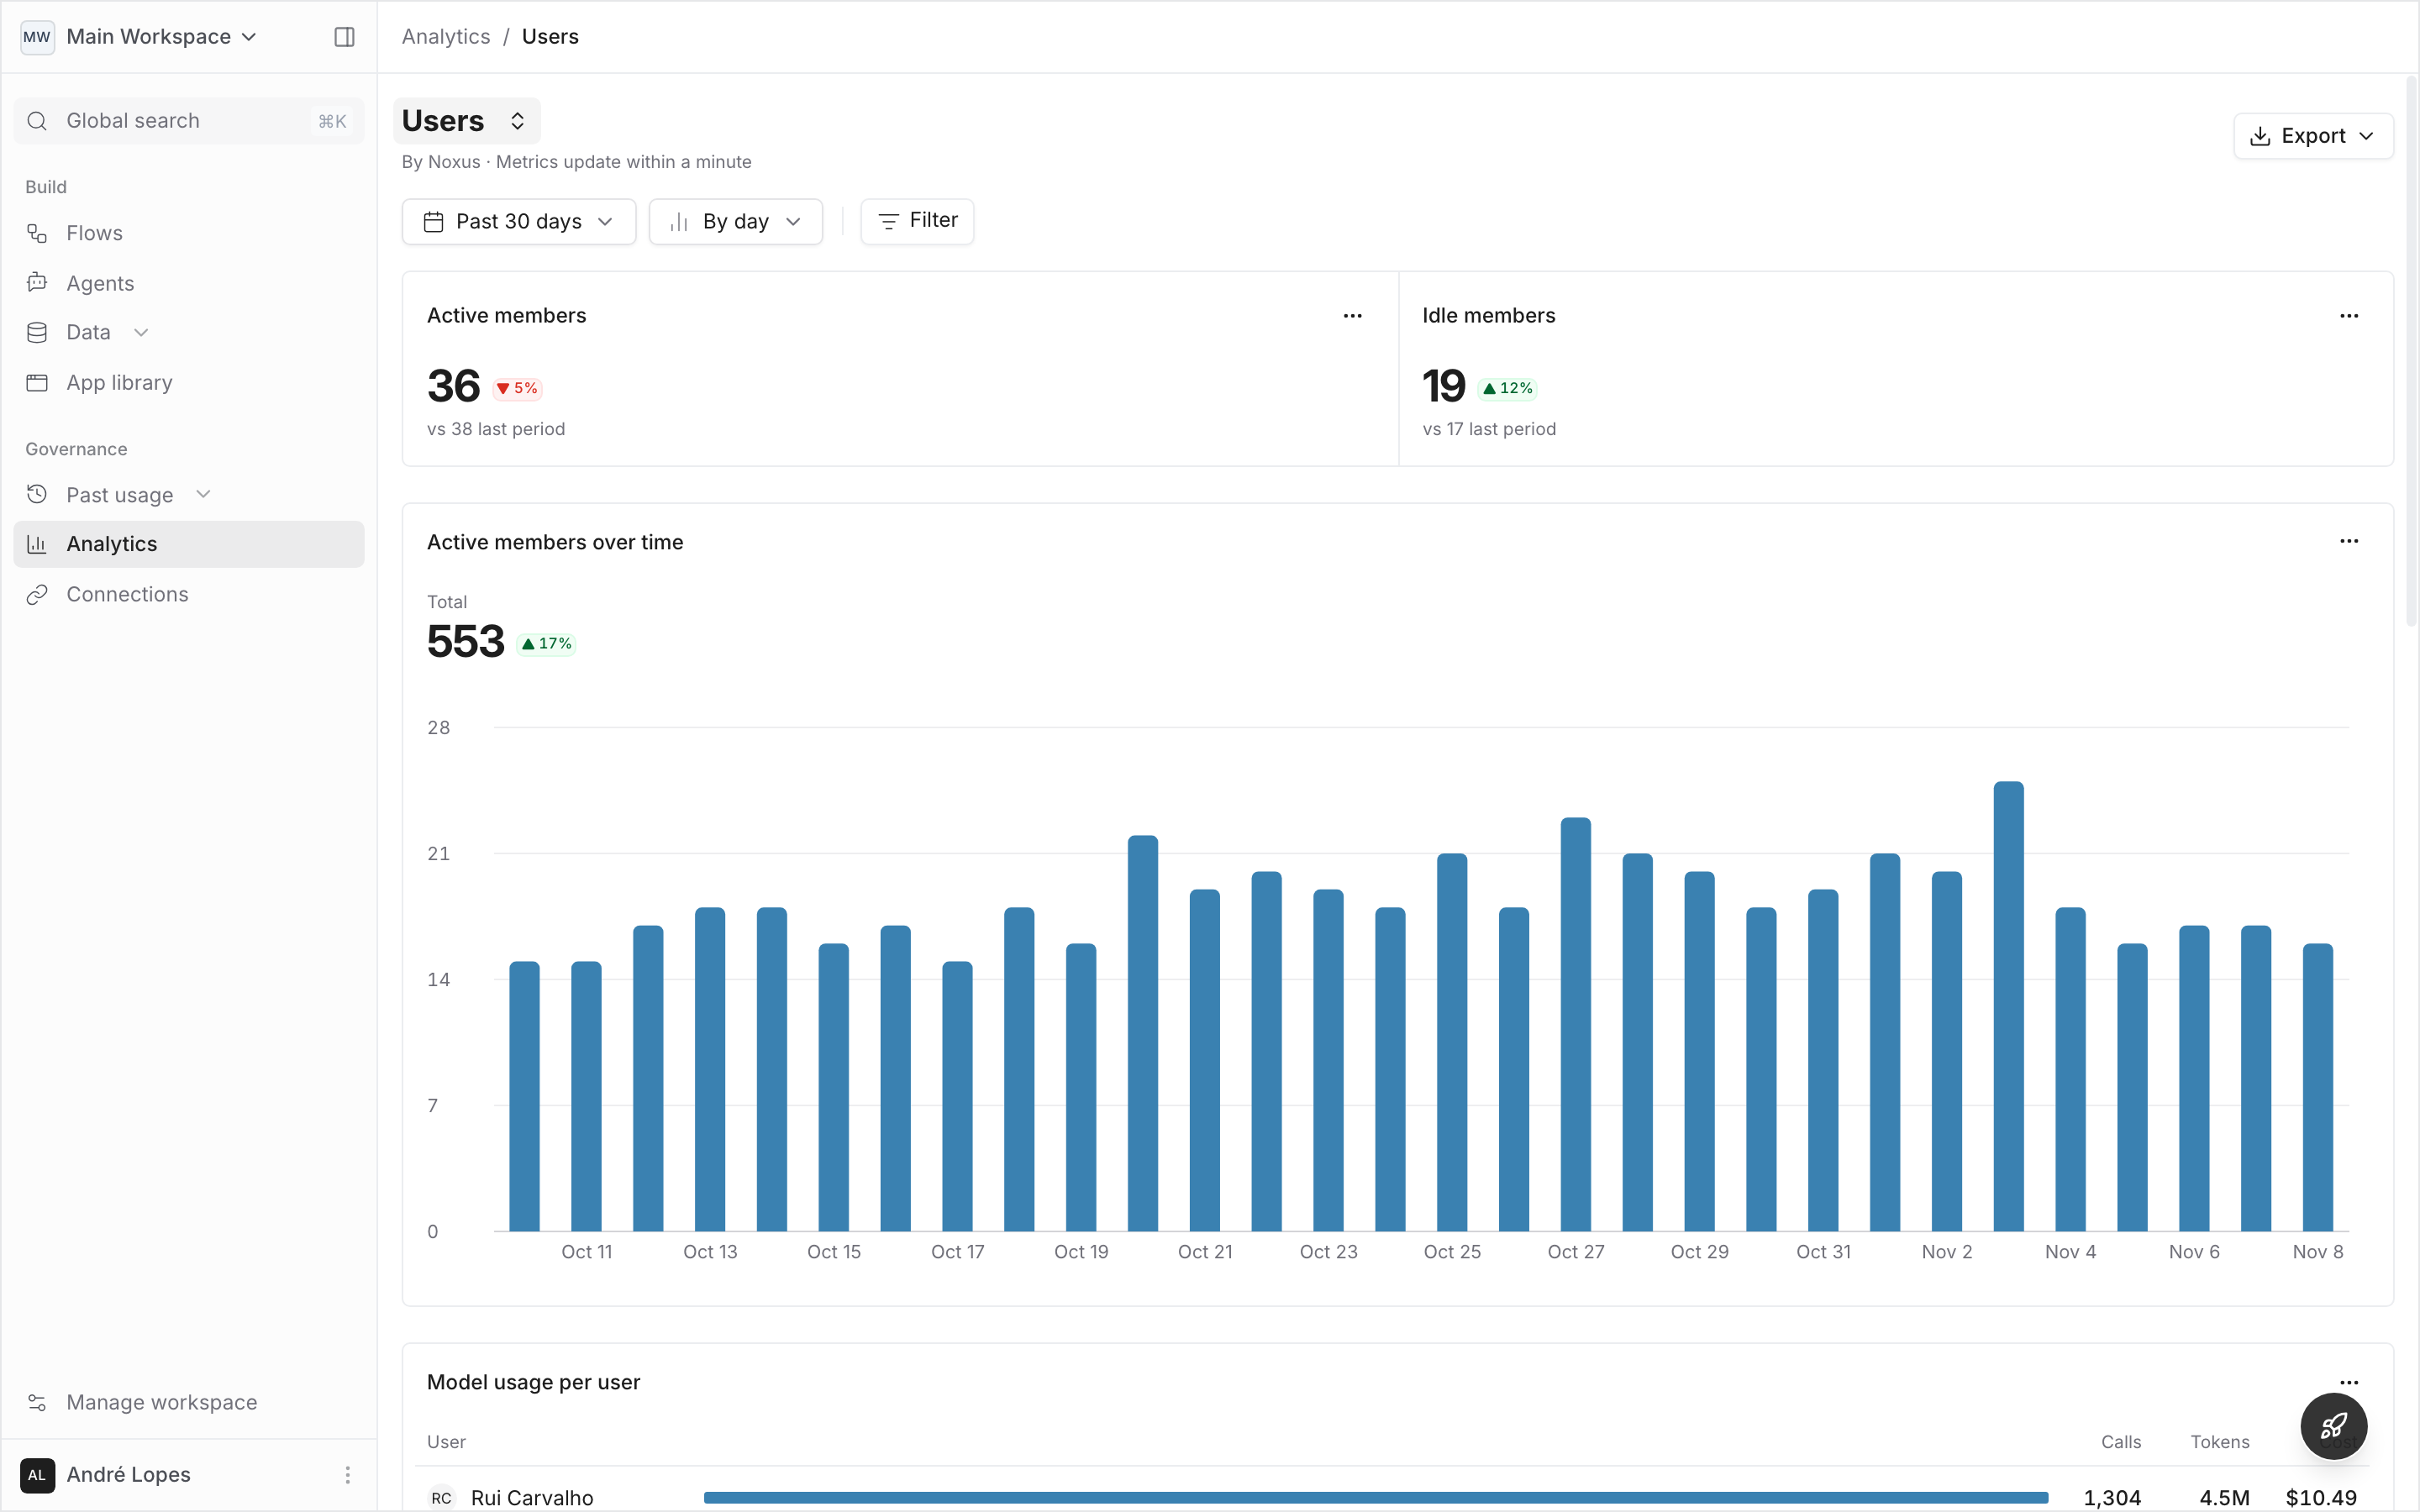
- Users
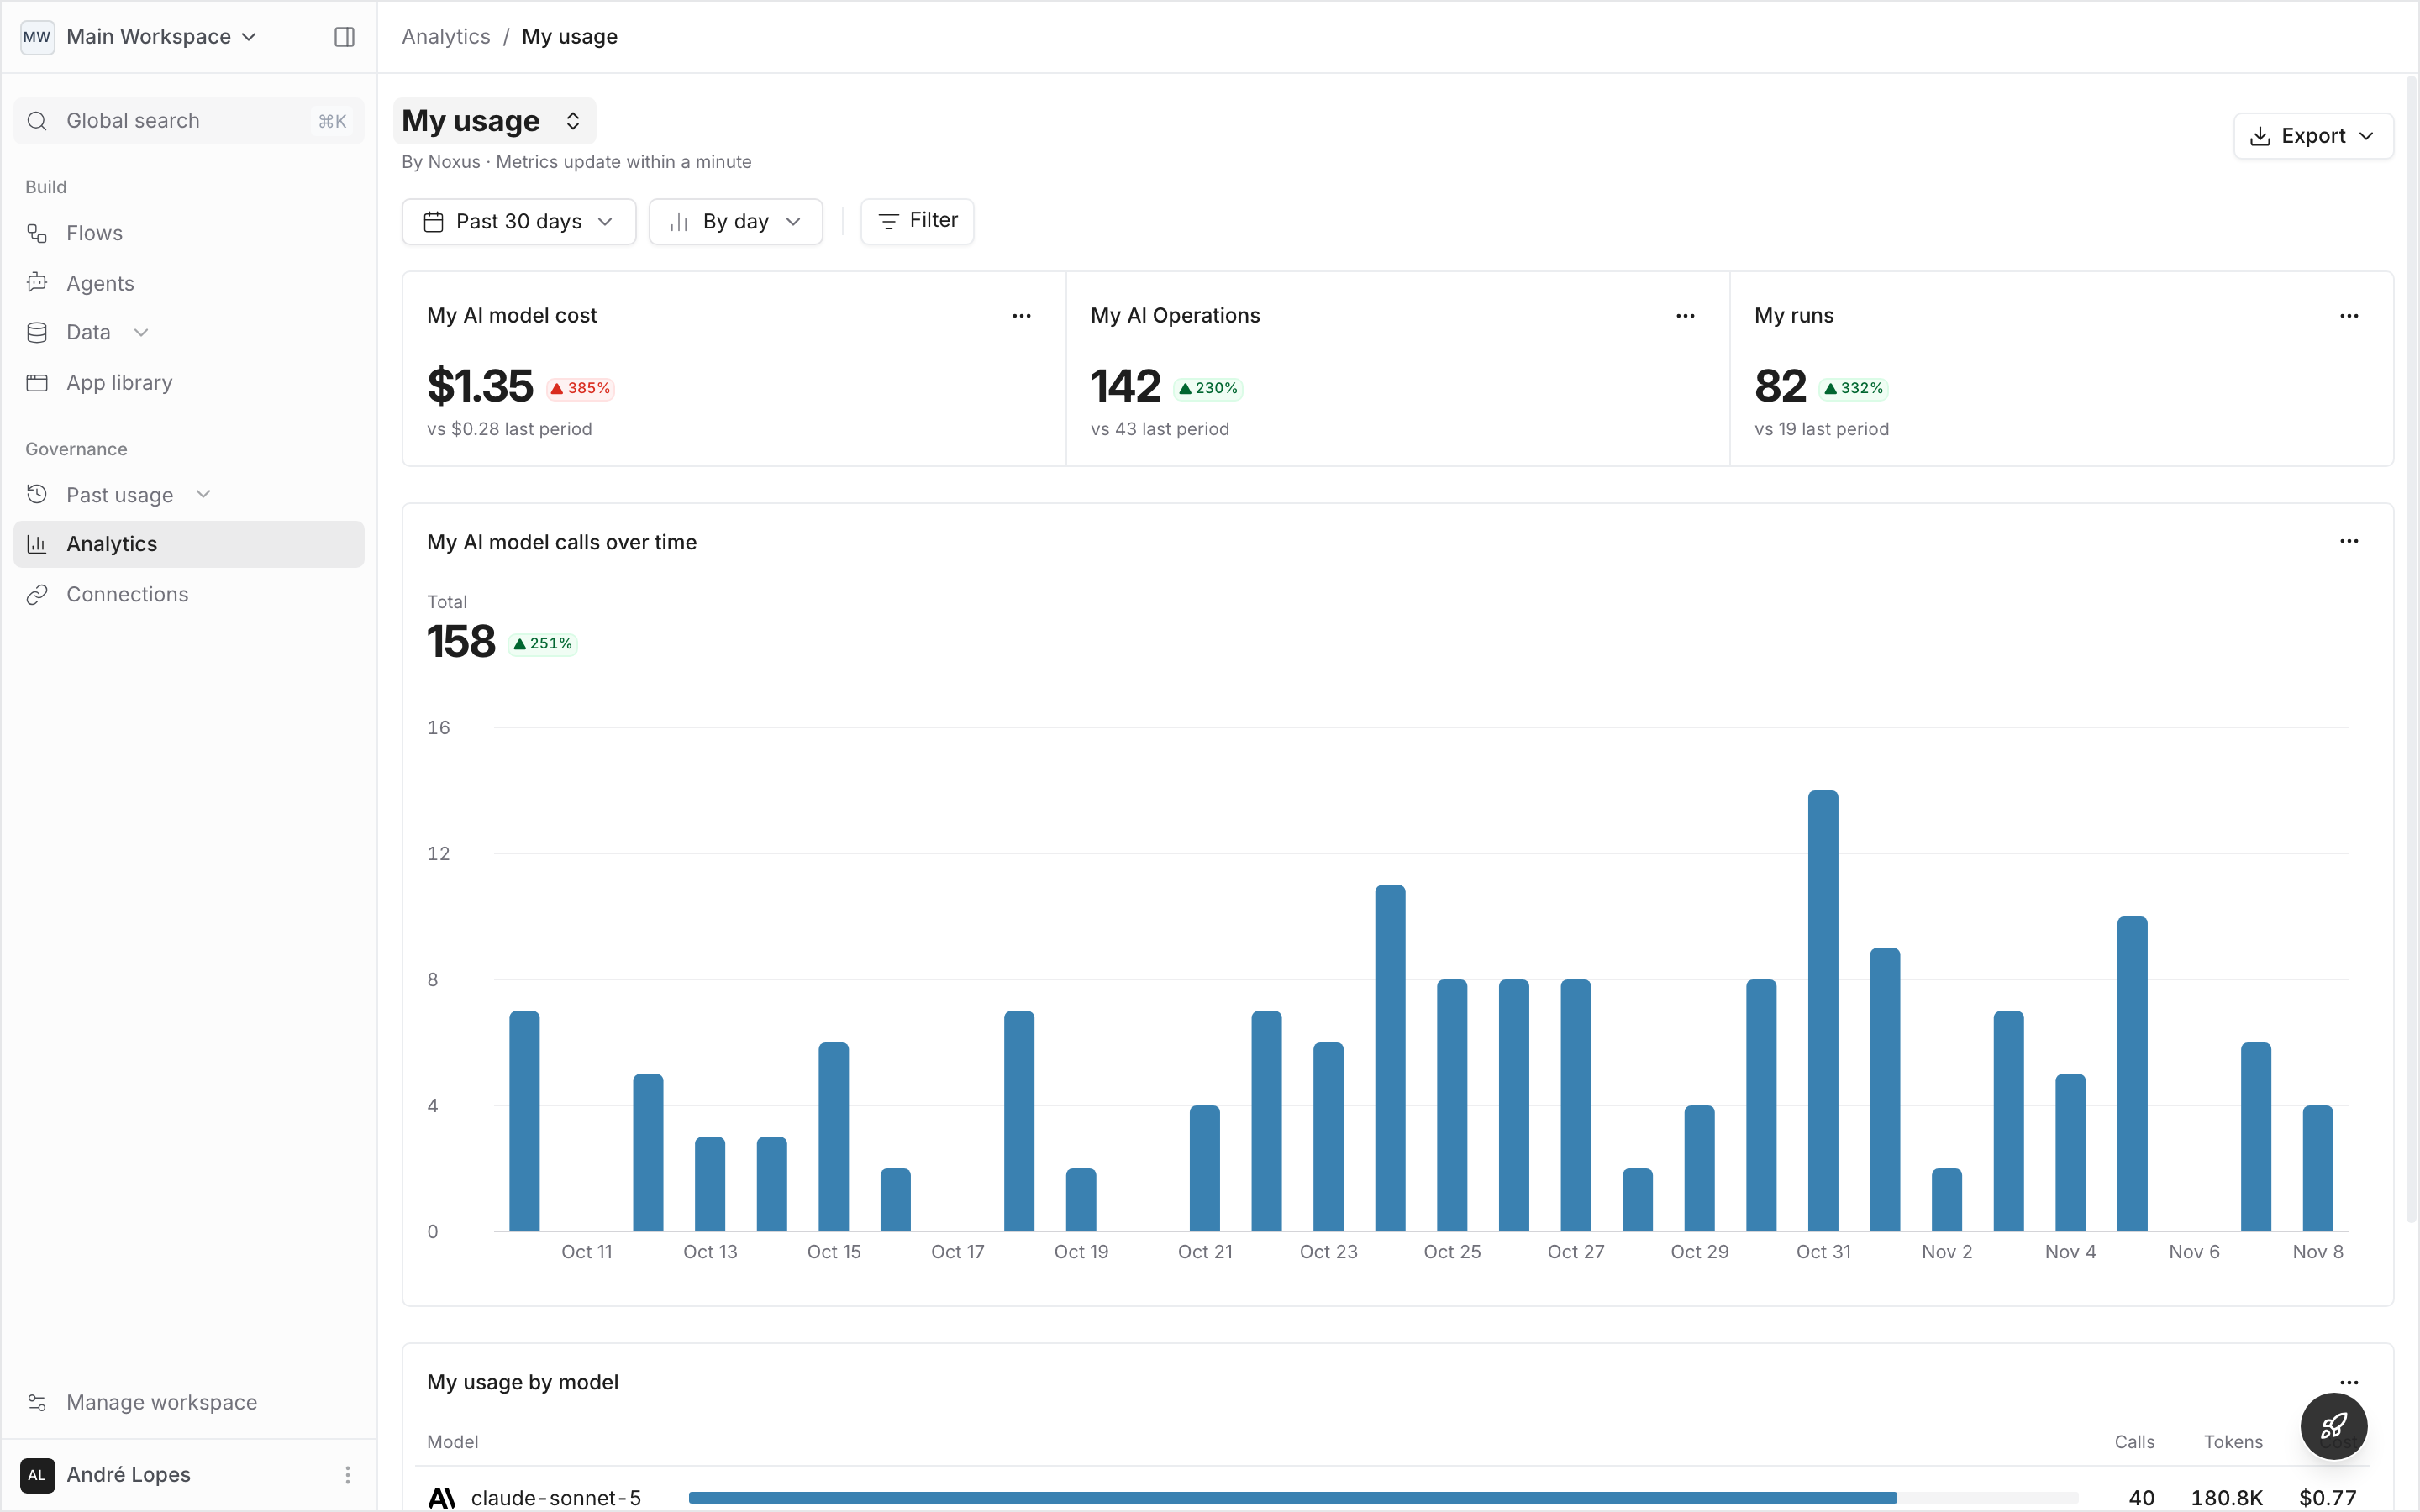
- My usage
What did this workspace use and cost?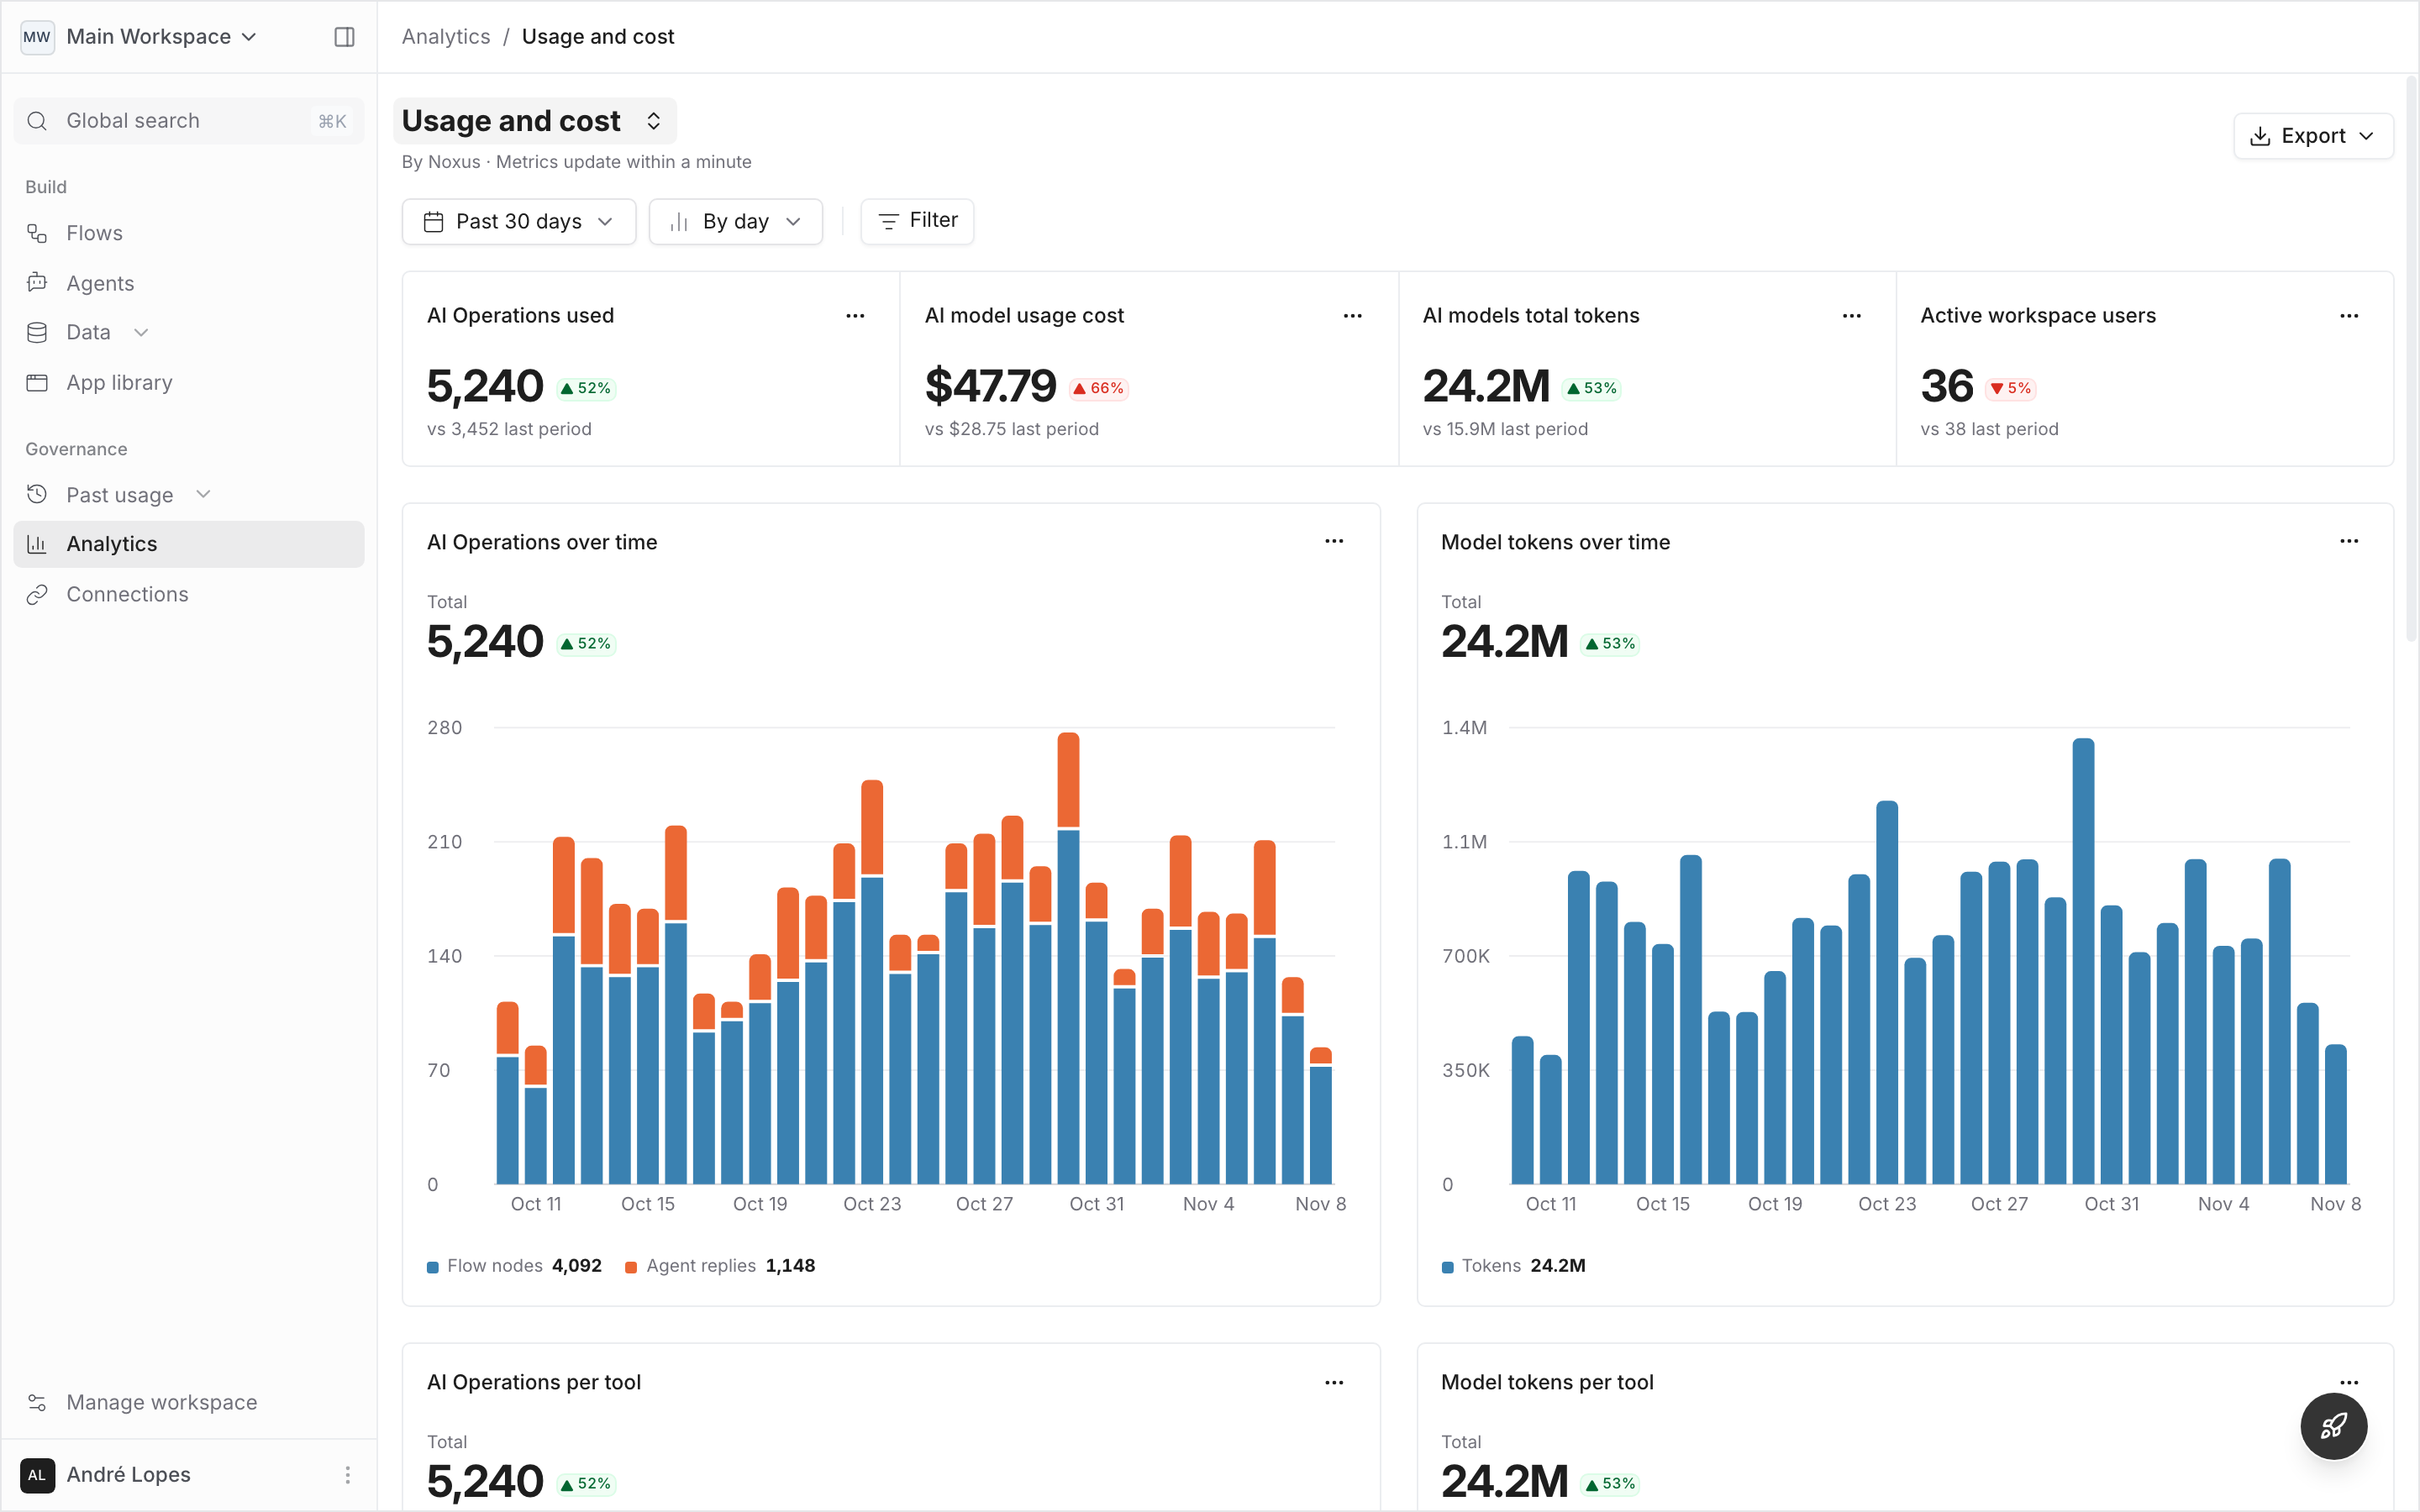
Reading a number
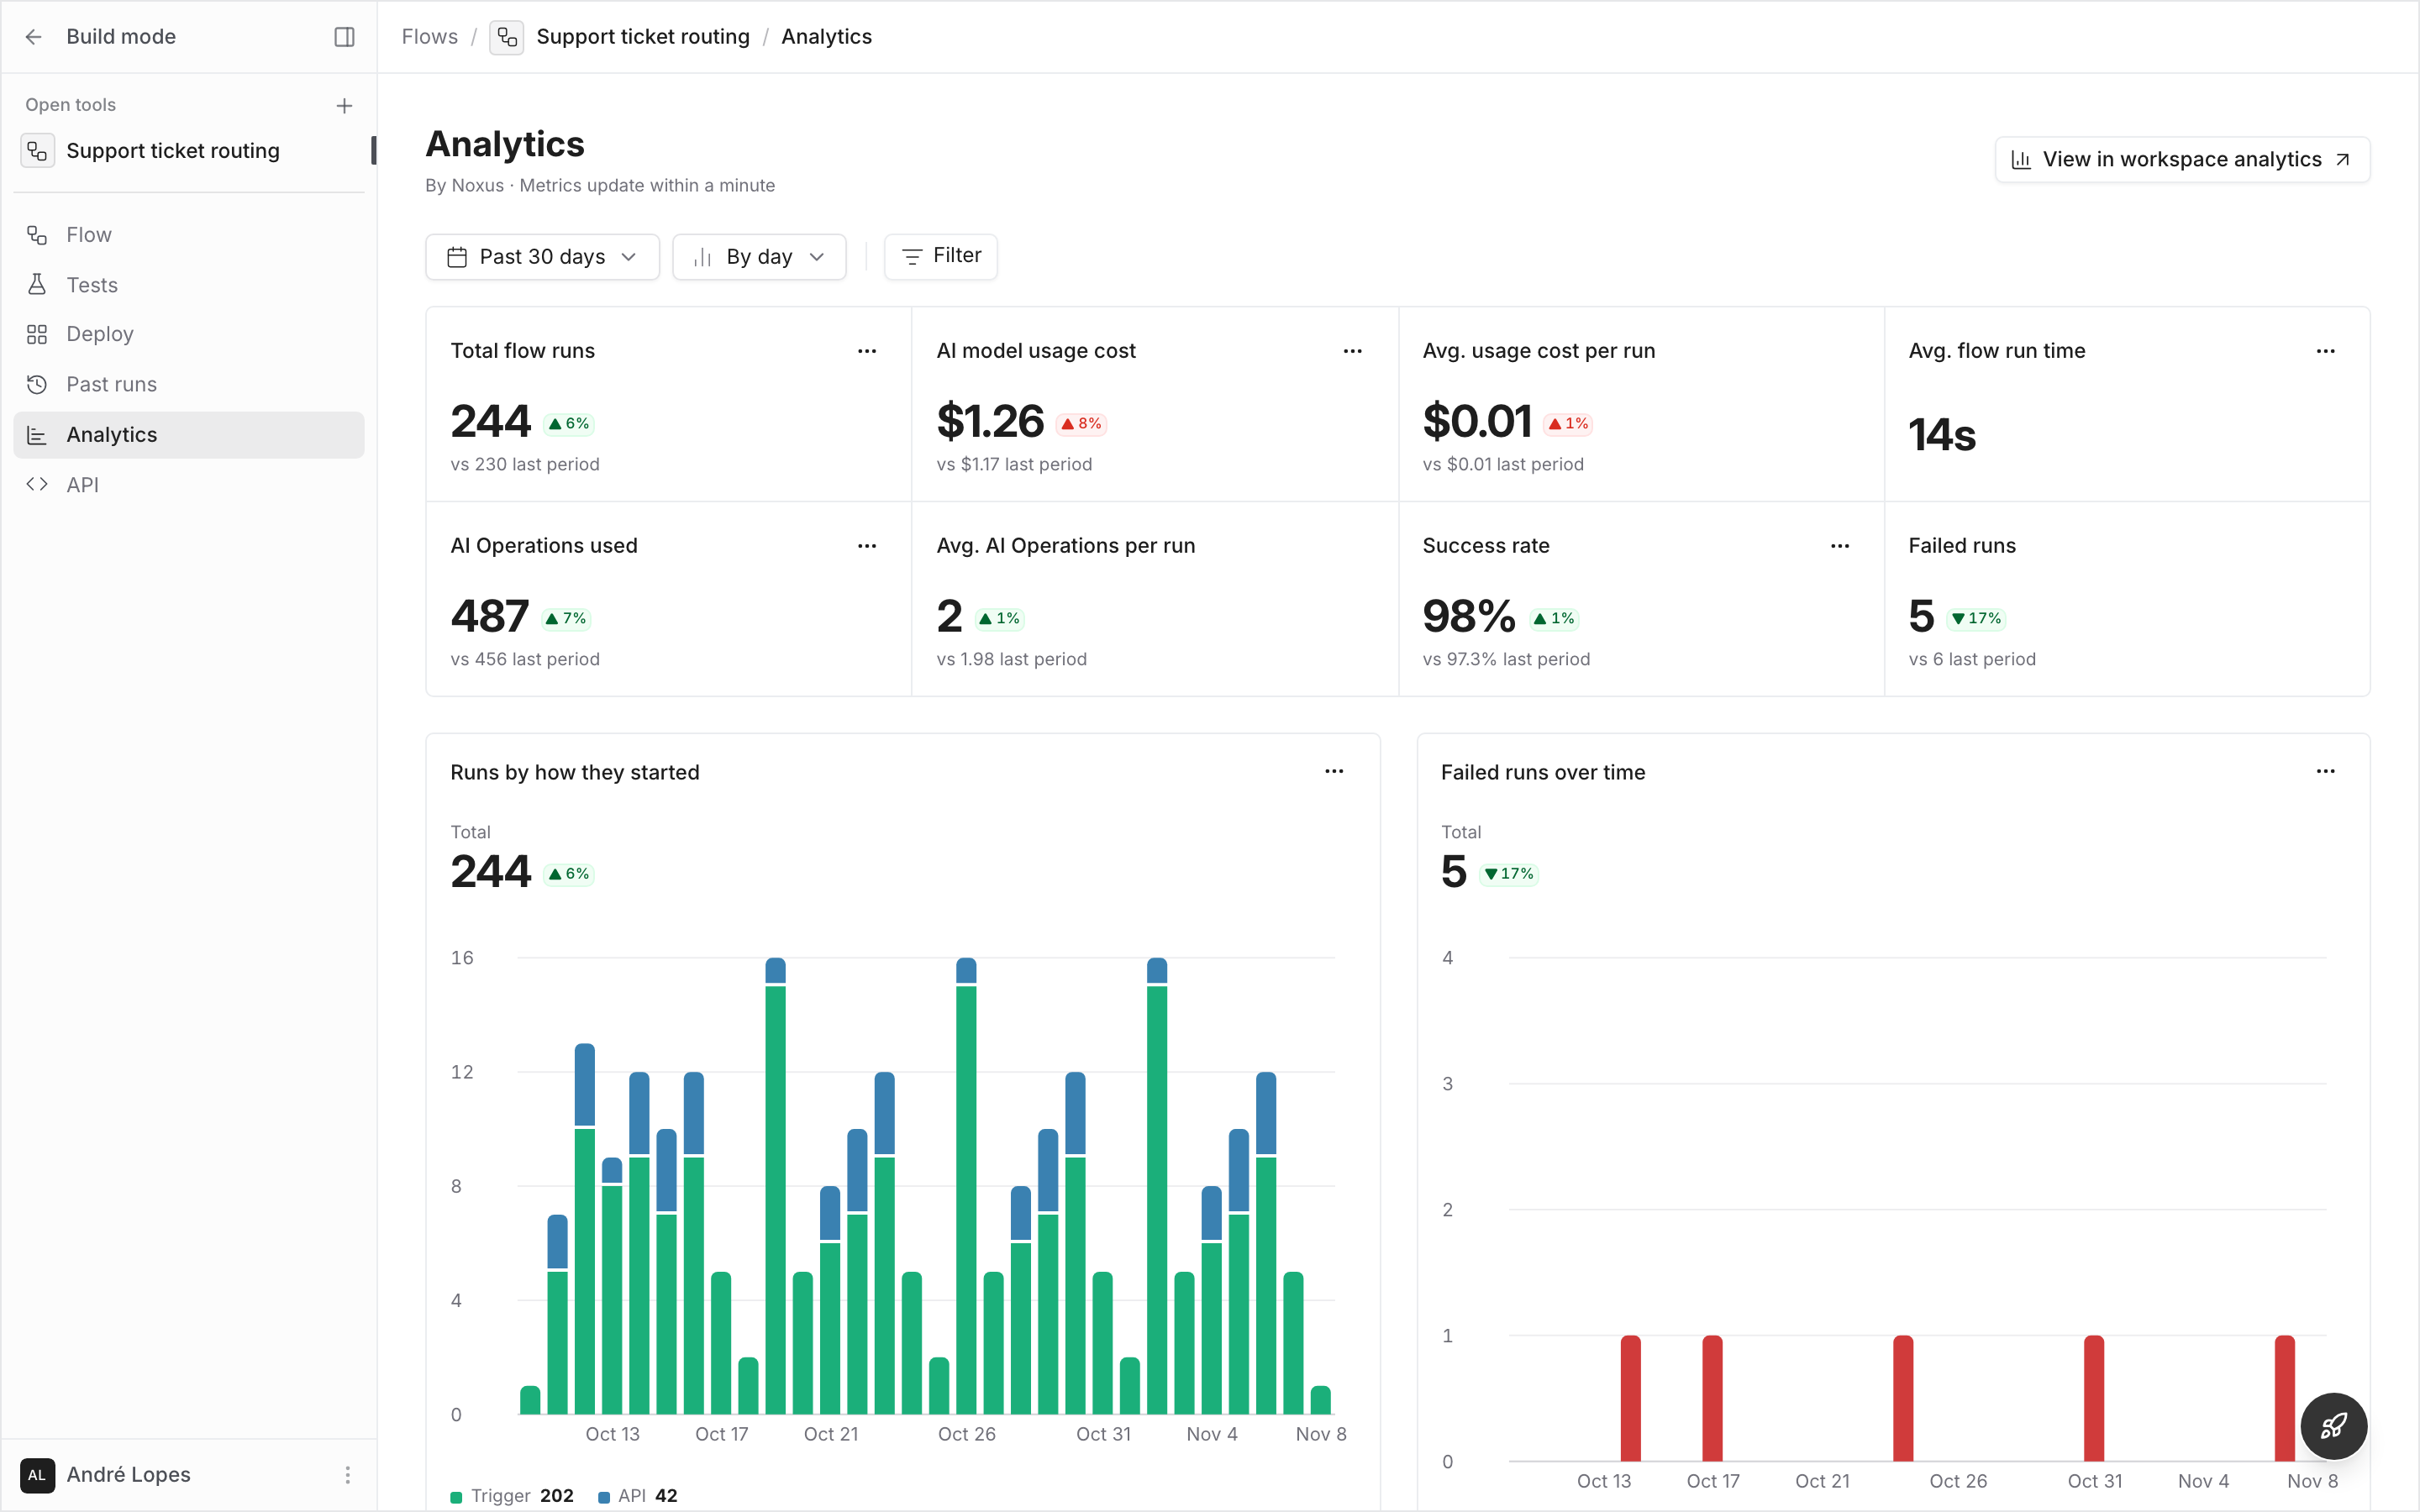
- Change badge: the number’s change against the period before. Green is good and red is bad, by what the number measures: fewer failed runs is green, fewer runs is red. Hover over it to see which period it compares with.
- Period before: today compares with yesterday up to the same hour, the current billing cycle with the last one up to the same day, the previous billing cycle with the whole cycle before it, and any other period with the one of the same length just before it.
- Cost: calculated from the tokens each call used, at the model’s catalogue rate, so it can differ from your provider’s invoice. An asterisk means some calls have no token count yet and are counted at their expected cost. Hover over it to see how it adds up. See AI model usage cost.
- Info icon: explains what the number counts, and links to its documentation.
- Not applicable: a widget whose number can’t be narrowed by an active filter says so, rather than showing a number that ignores the filter.