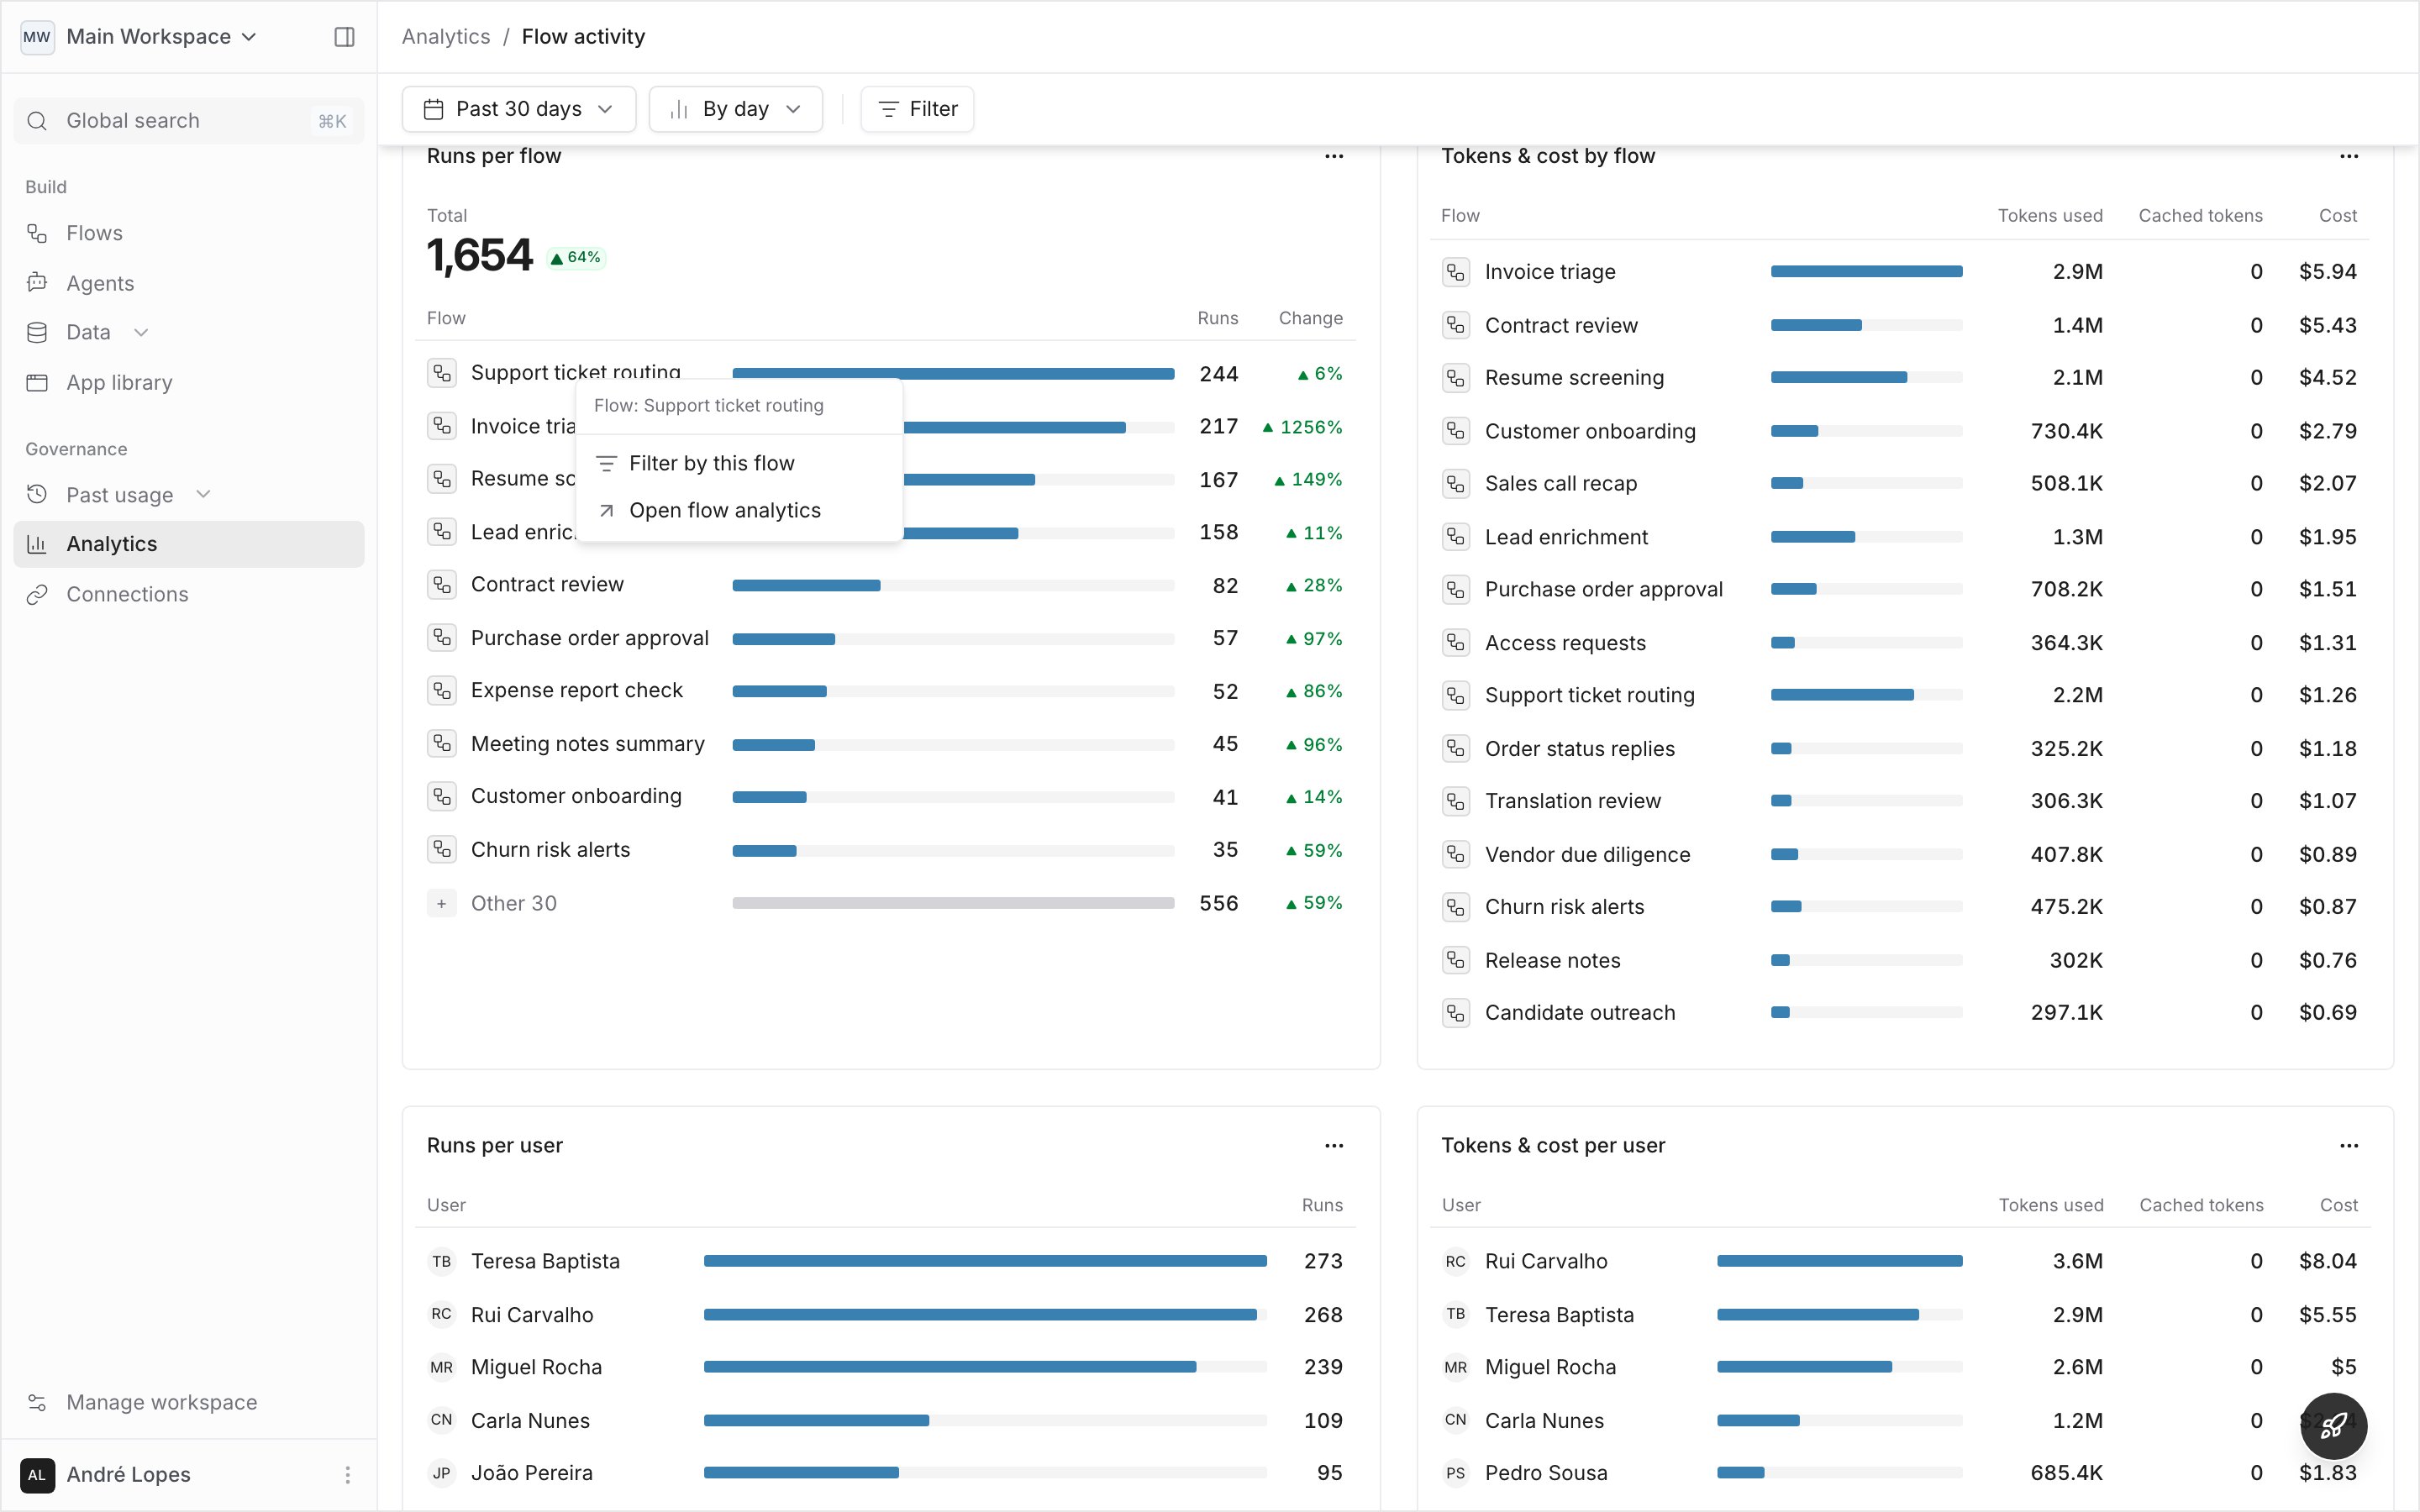
Period
Click the dates to pick the period the page reads.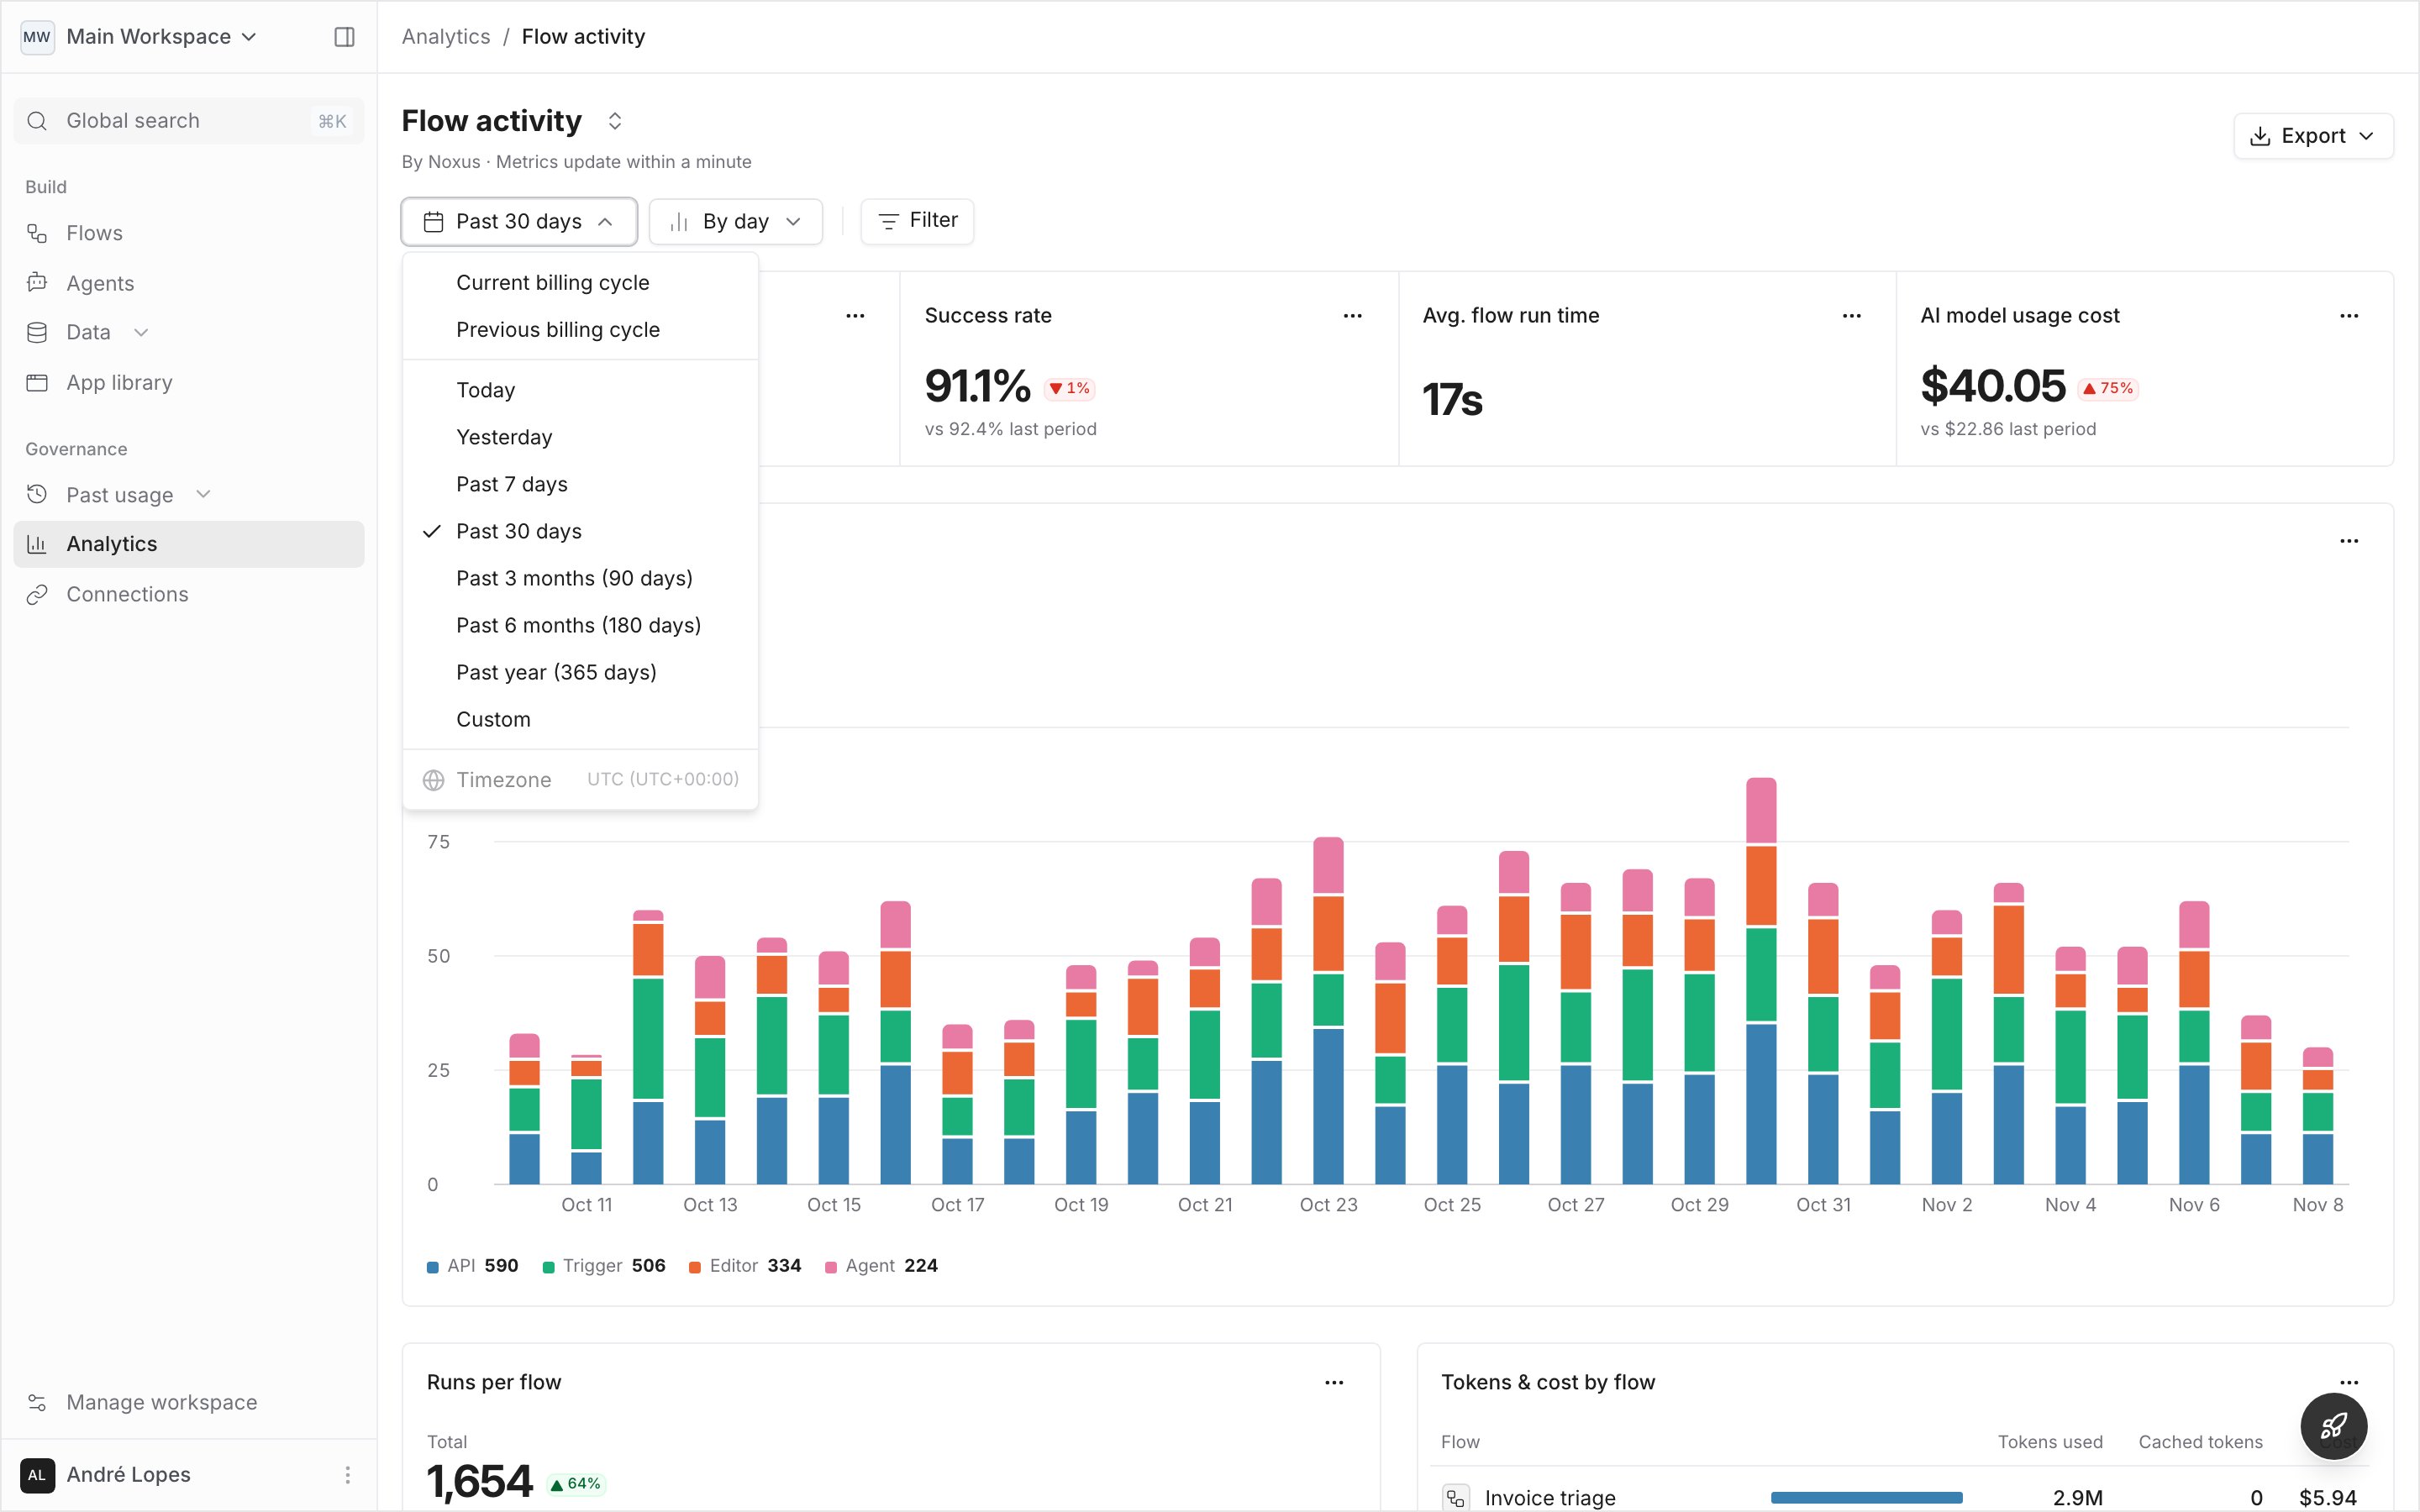
The period you pick is kept while you move between boards, and written into the page’s address, so a link opens on the same dates.
Time zone
Timezone, at the bottom of the period menu, sets the zone a period of two days or less is read in: its days start at that zone’s midnight, its hourly charts cut there, and times in tables show in it. Pick Browser time, UTC (the default), a listed city, or search for any other zone. The pick is kept in this browser. Periods longer than two days are always read in UTC. The Timezone row is then disabled, and hovering over it says so. Billing cycles are always UTC calendar months.Grouping
The second button groups the over-time charts by hour, by day, by week or by month. Until you pick one, it follows the period’s length: by hour up to three days, by day up to two months, and by week beyond.Filter menu
Click Filter, pick a dimension, search its values, select one or more and click Apply. Each active filter shows as a chip: click the chip to add or remove values, or its close button to remove it.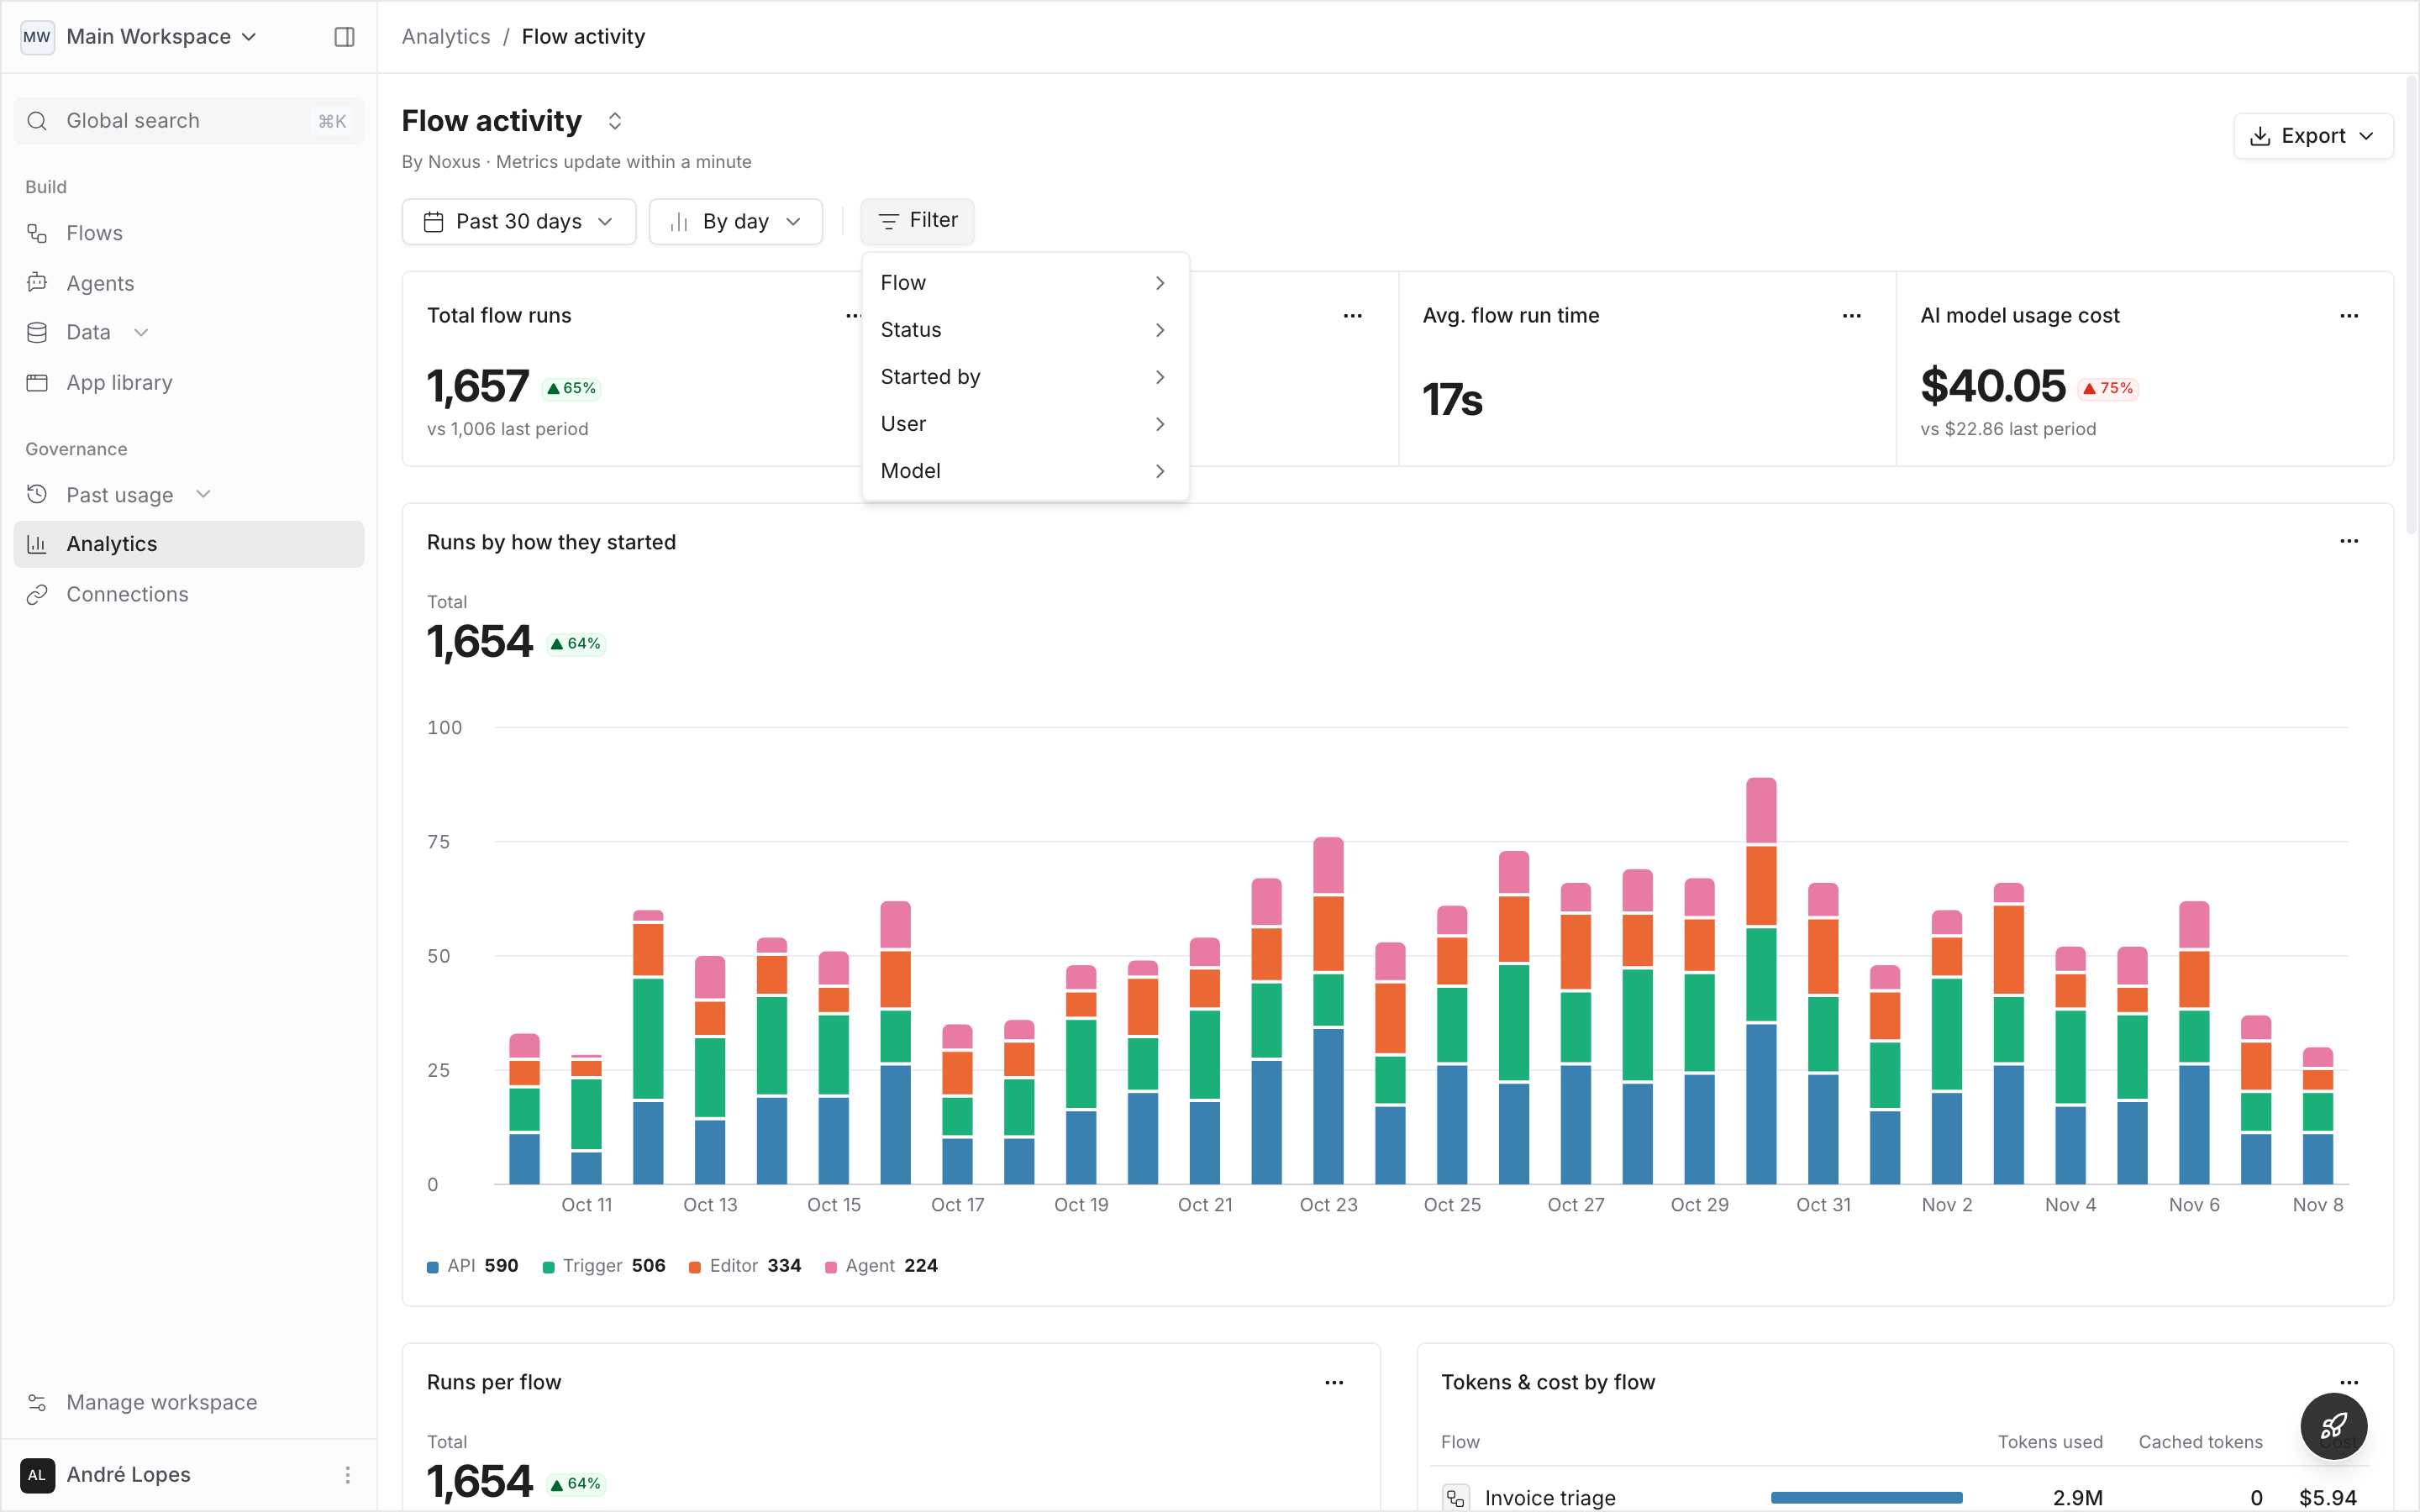
A flow and an agent are both tools, so on Usage and cost picking some of each shows both. Status, Started by and Channel narrow AI Operations and model usage to the runs and conversations that match.
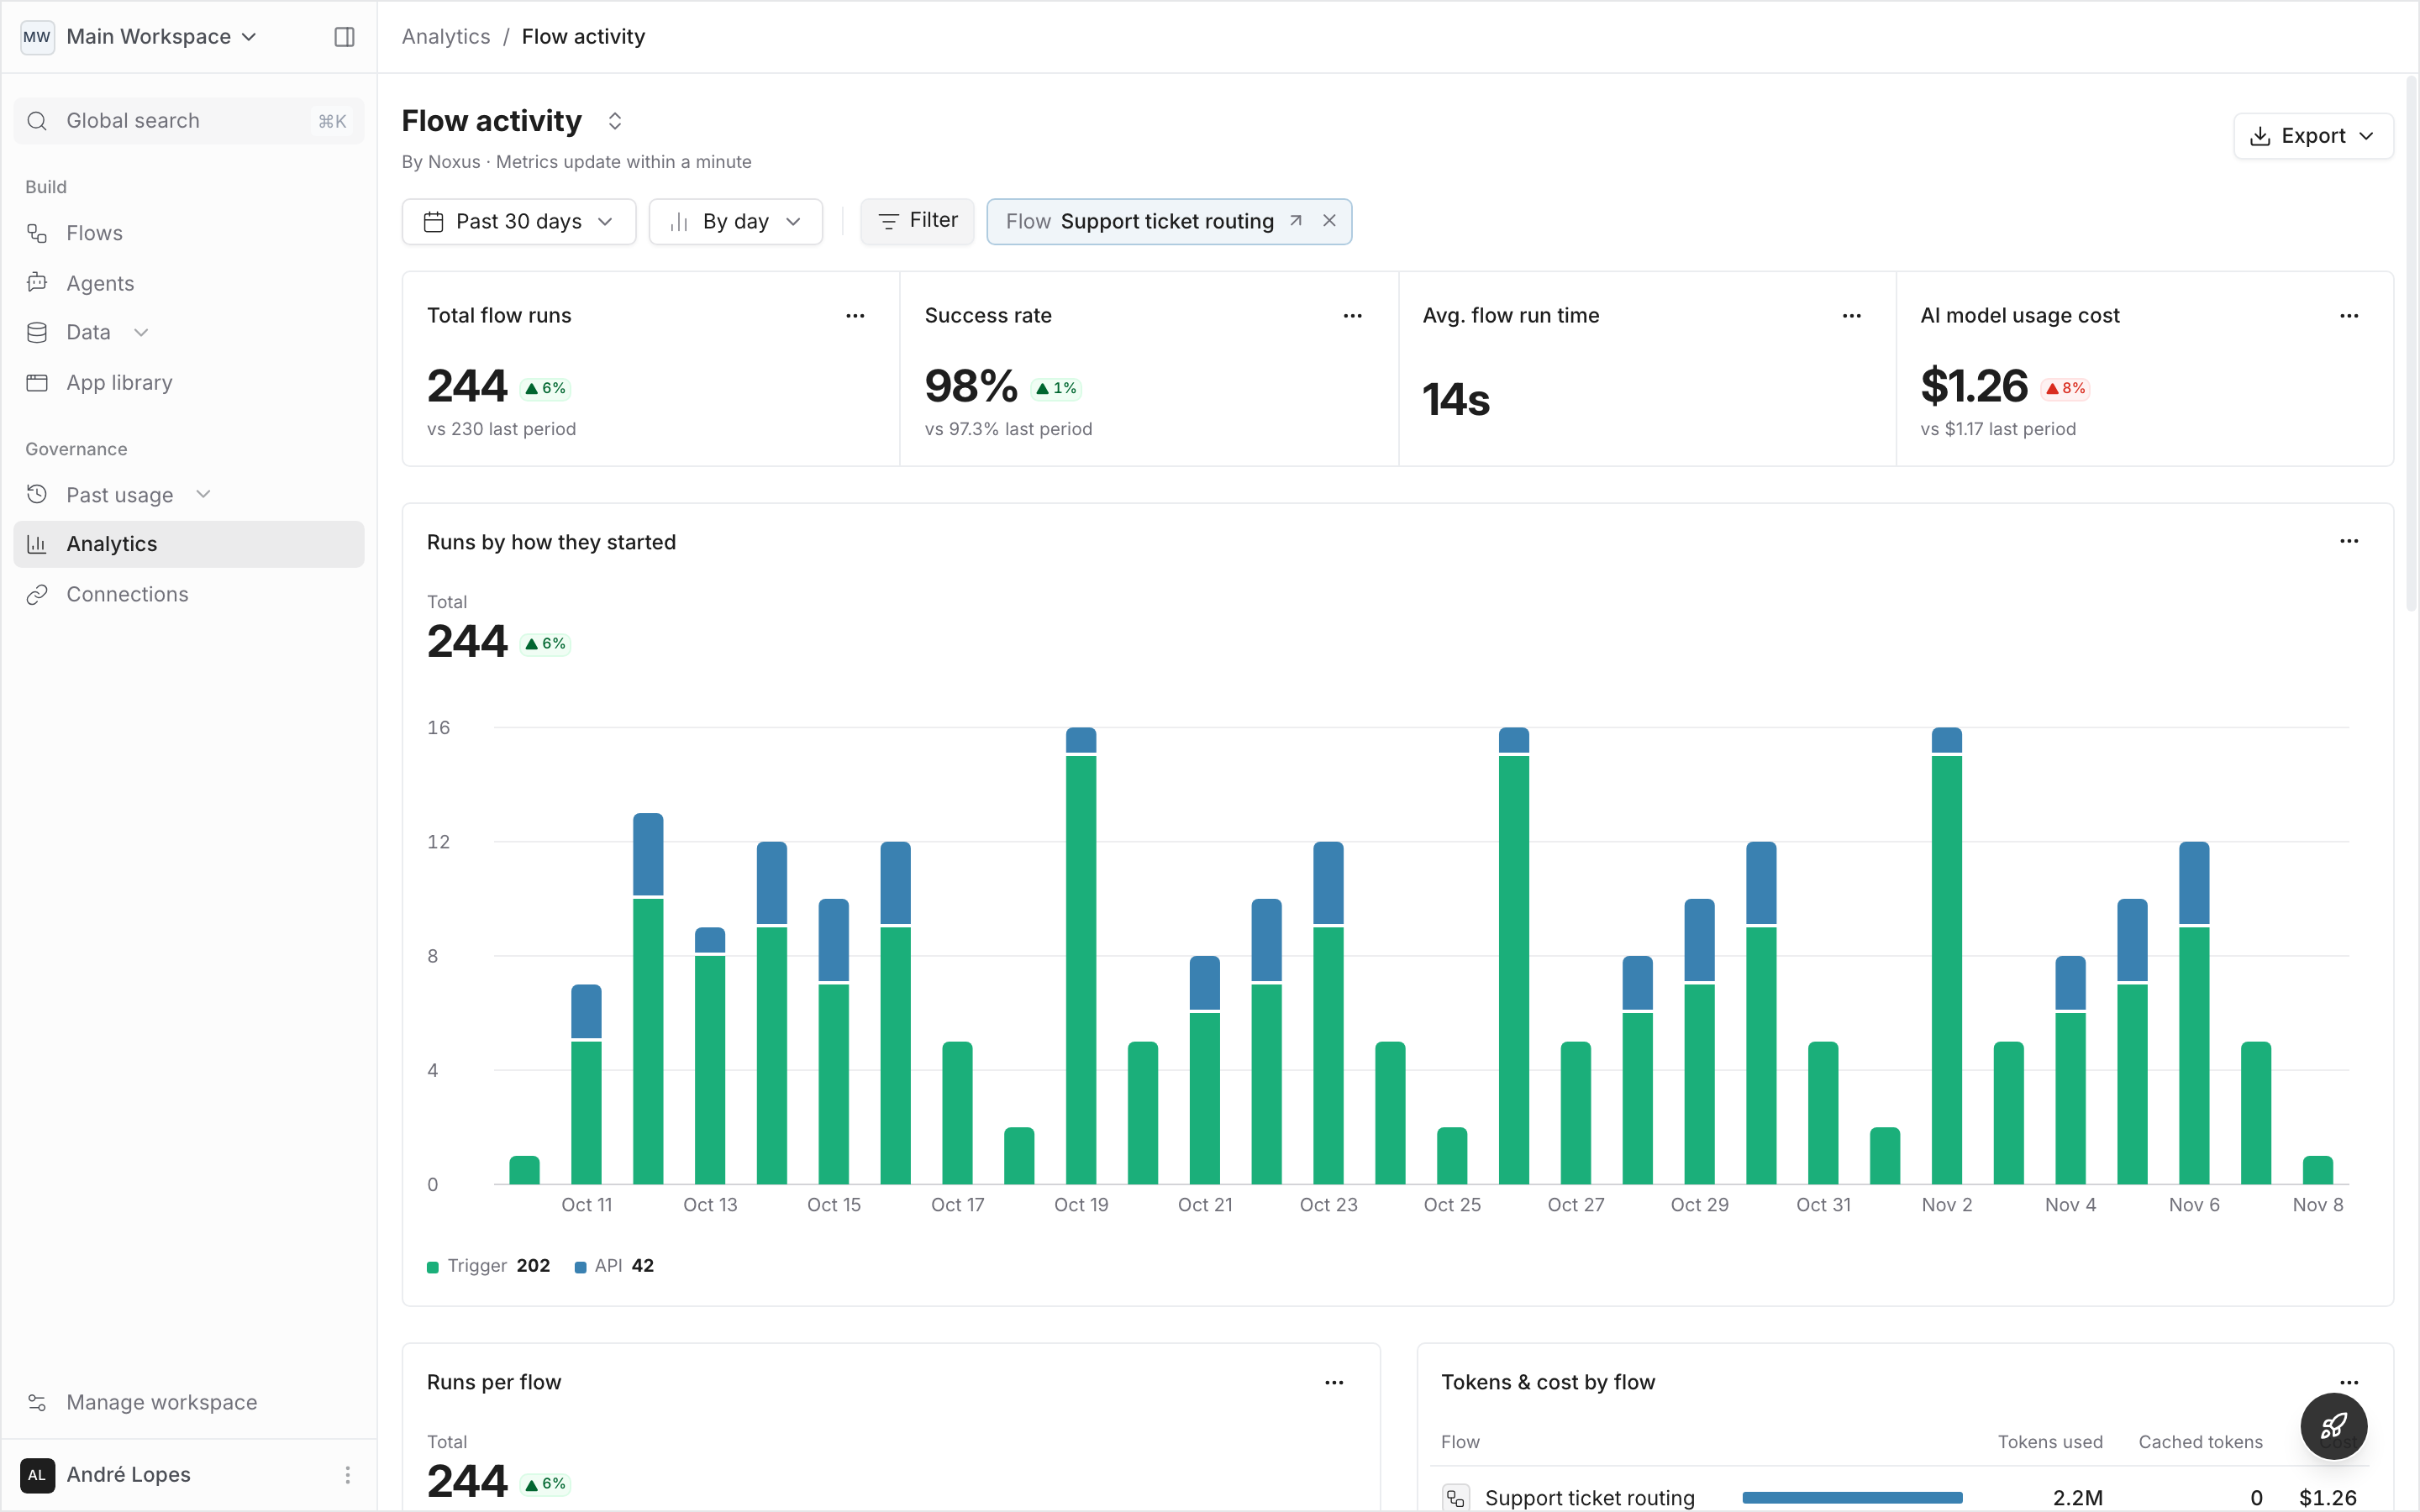
A Flow or Agent chip holding a single tool has a button that opens that tool’s Analytics tab over the same period.
A widget whose number can’t be narrowed by an active filter shows as not applicable instead of an unfiltered number.
Drilling down
Move from a number to what is behind it without leaving the page.- Click a value
- Right click a value
- Click a bar
Click a flow, agent, user, model or knowledge base in a chart or a table to filter the whole page to it. A message says what the data is now filtered by, and the value is added as a chip.For example, click Support ticket routing in Runs per flow to see only that flow’s runs, cost and failures.