

The Analytics tab
Open a flow and click Analytics in its sidebar. The tab has the same filter bar as the boards in Analytics: the period, the grouping, and the Filter menu, with Run, Status, Started by, Version, User and Model.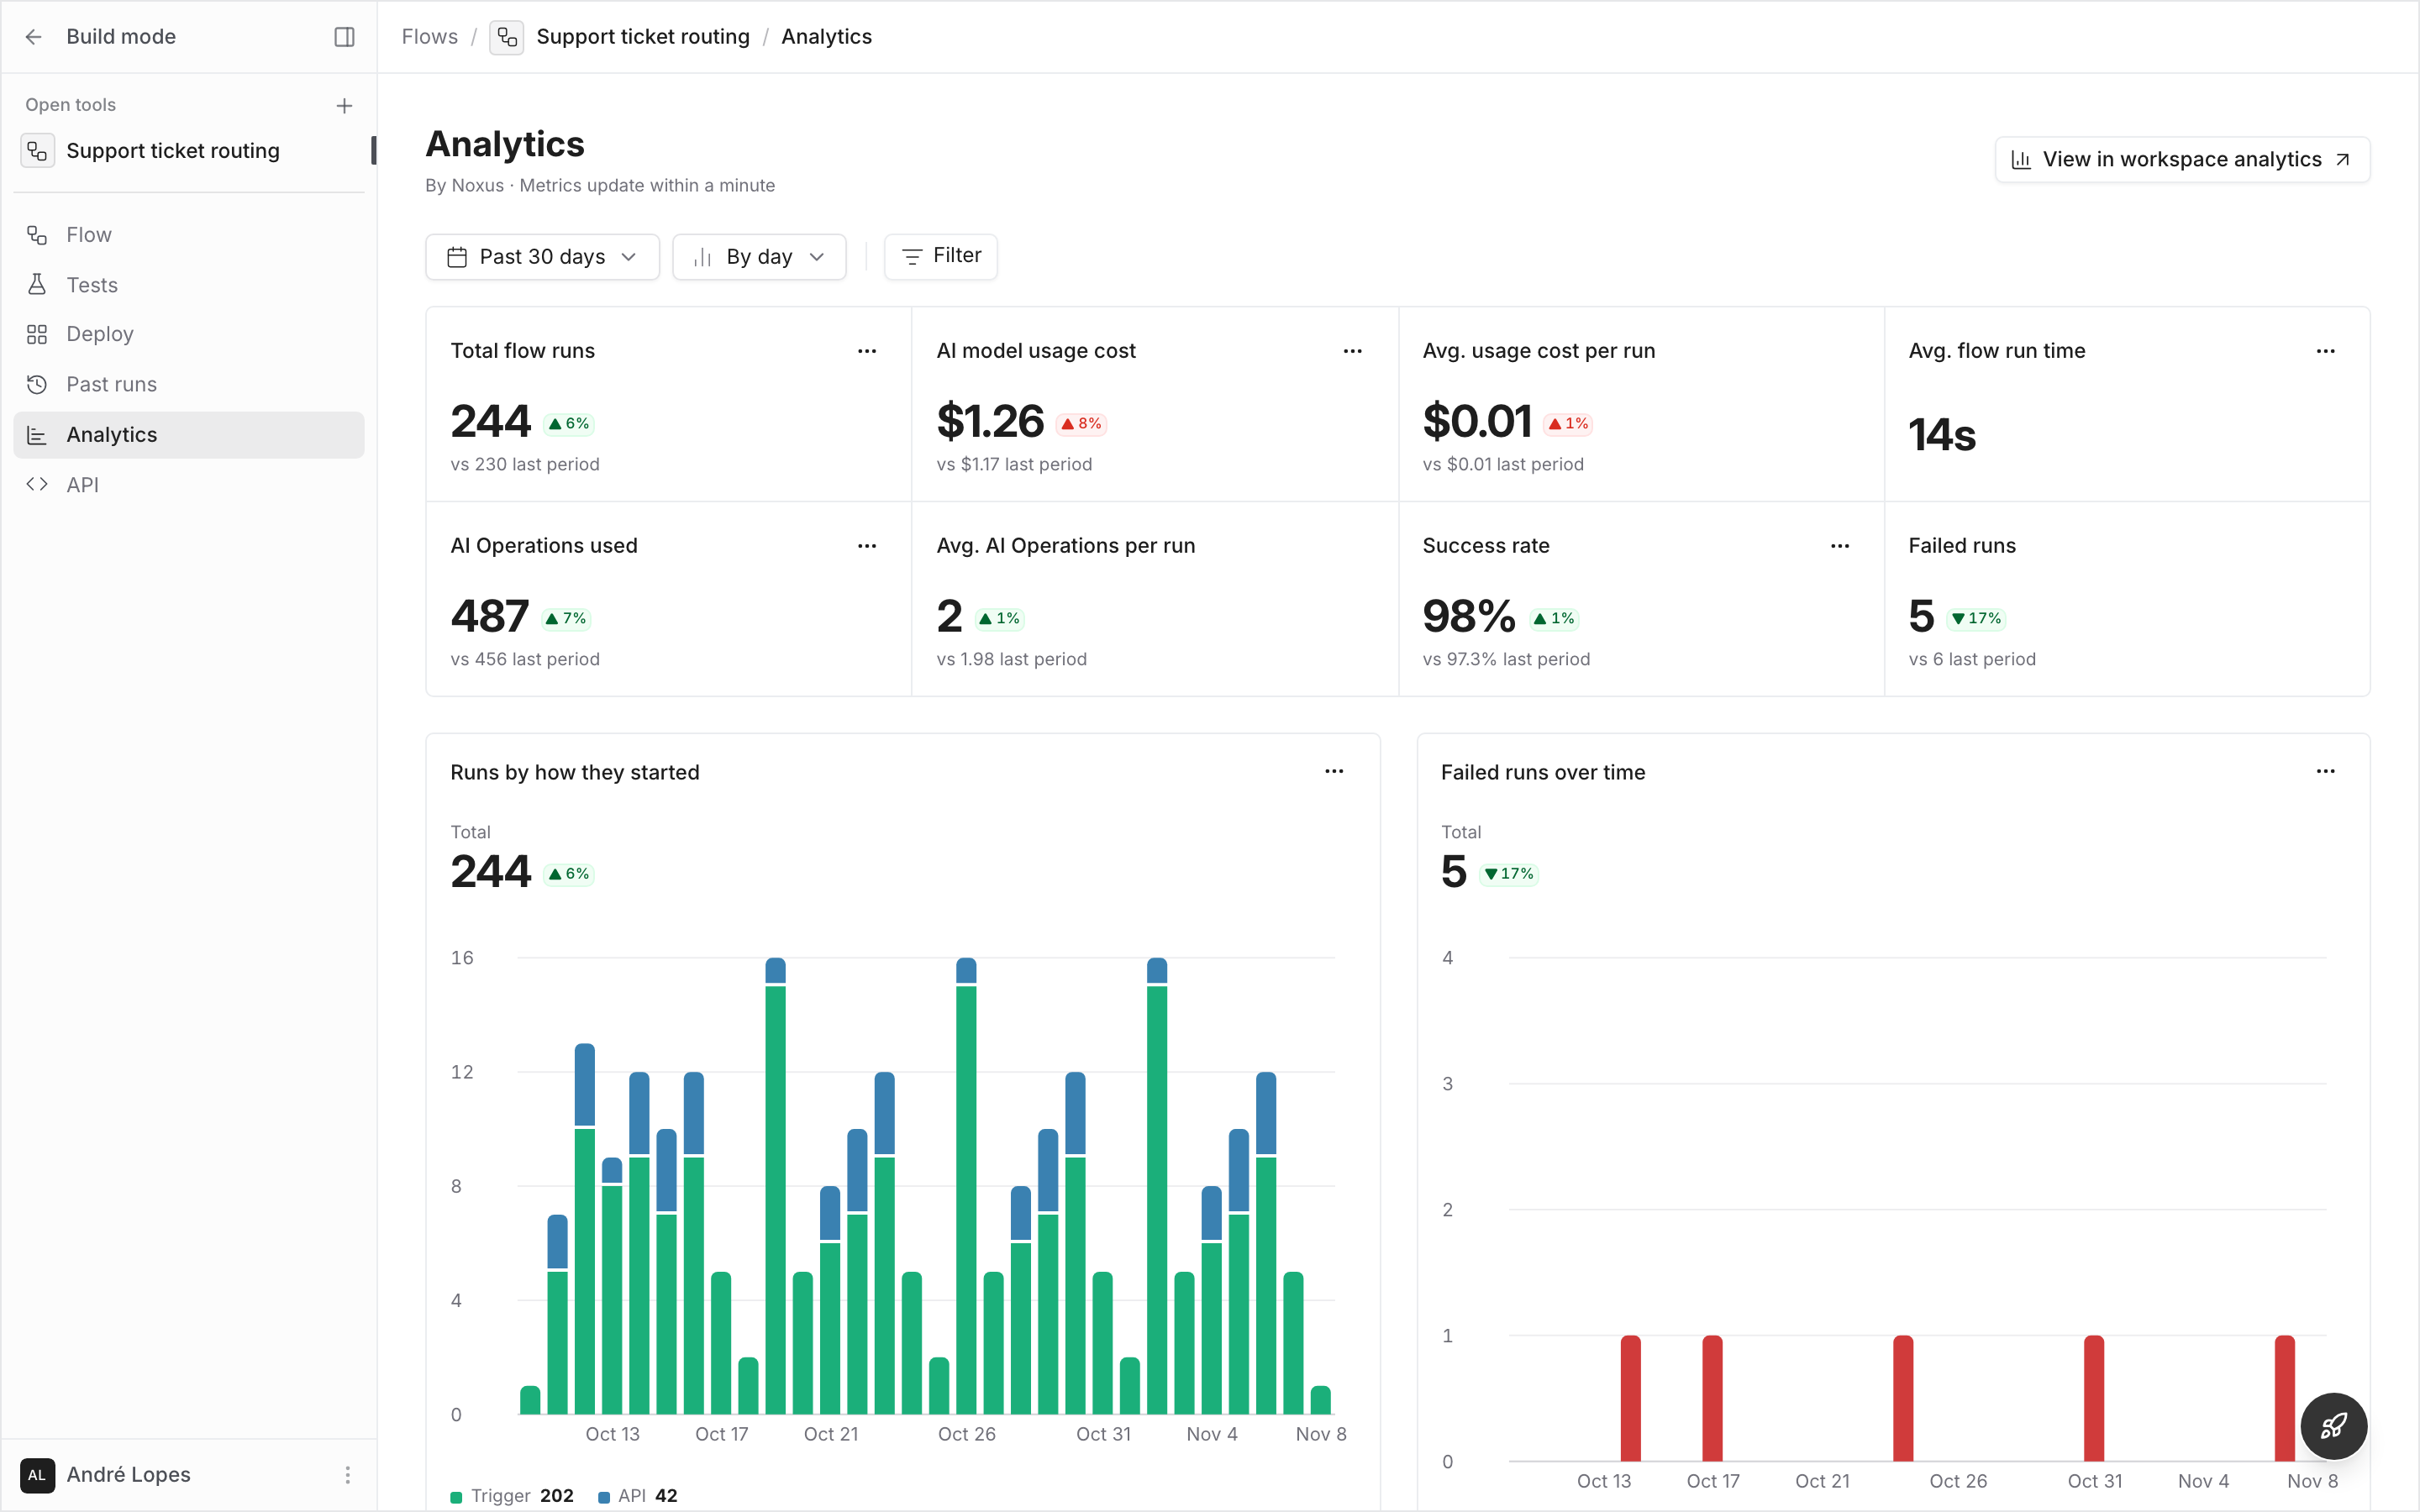
View in workspace analytics, beside the title, opens Flow activity in Analytics filtered to this flow, over the same period.
The Analytics tab needs View workspace analytics.
A single run
A run’s own time and cost are on its Metrics tab, in the run panel.1
Open the run
Open the flow’s Past runs tab and click a run, or click its Cost. In Past usage, the Cost column and the row menu’s See cost breakdown open the same tab.
2
Read its time and cost
The top of the tab shows the run’s duration, how long it waited in the queue, its total cost and its tokens.
3
See where the cost went
Nodes lists the nodes that called a model, the most expensive first. Expand one to see each of its model calls. Nodes that called no model are folded into one row at the end.
4
See where the time went
Timeline shows every node in run order, when it ran within the run and how long it took.
5
Compare it with other runs
Open in flow analytics opens the flow’s Analytics tab filtered to this run, over the days it ran. The run shows as a chip; remove it to see the whole flow again.
What counts
- Runs: every run of the flow, whatever started it. Started by splits them by API, editor, trigger, app, agent or test.
- Failed runs: runs that ended in an error.
- Cost: the tokens each call used, priced at the model’s catalogue rate, plus estimates for calls still running or without a usage report. It is what model usage budgets count, and can differ from your provider’s invoice. See AI model usage cost.
- Voice calls count in cost alongside language and decision calls, but not in token totals.
- Health checks that test a model connection are never counted.
- Deleted runs are not counted.