

Overview
- Analytics Boards: The boards in Analytics, what each answers and the numbers it shows.
- Filters and Drill-Downs: Periods, time zones, grouping, filters, and moving from a number to what is behind it.
- Analytics in Building Blocks: The Analytics tab of a flow, an agent and a knowledge base, and the metrics of a single run or conversation.
- Organization Analytics: Usage, Models and Users across every workspace, in Settings.
- Agent Insights: What users ask an agent about, and how satisfied they are.
- Best Practices: Read the numbers well, and find the cause behind a change.
Key concepts
- Board: a page of numbers, charts and tables that answers one question, such as “How are flows running?”. The boards Noxus makes are listed in the board’s title menu.
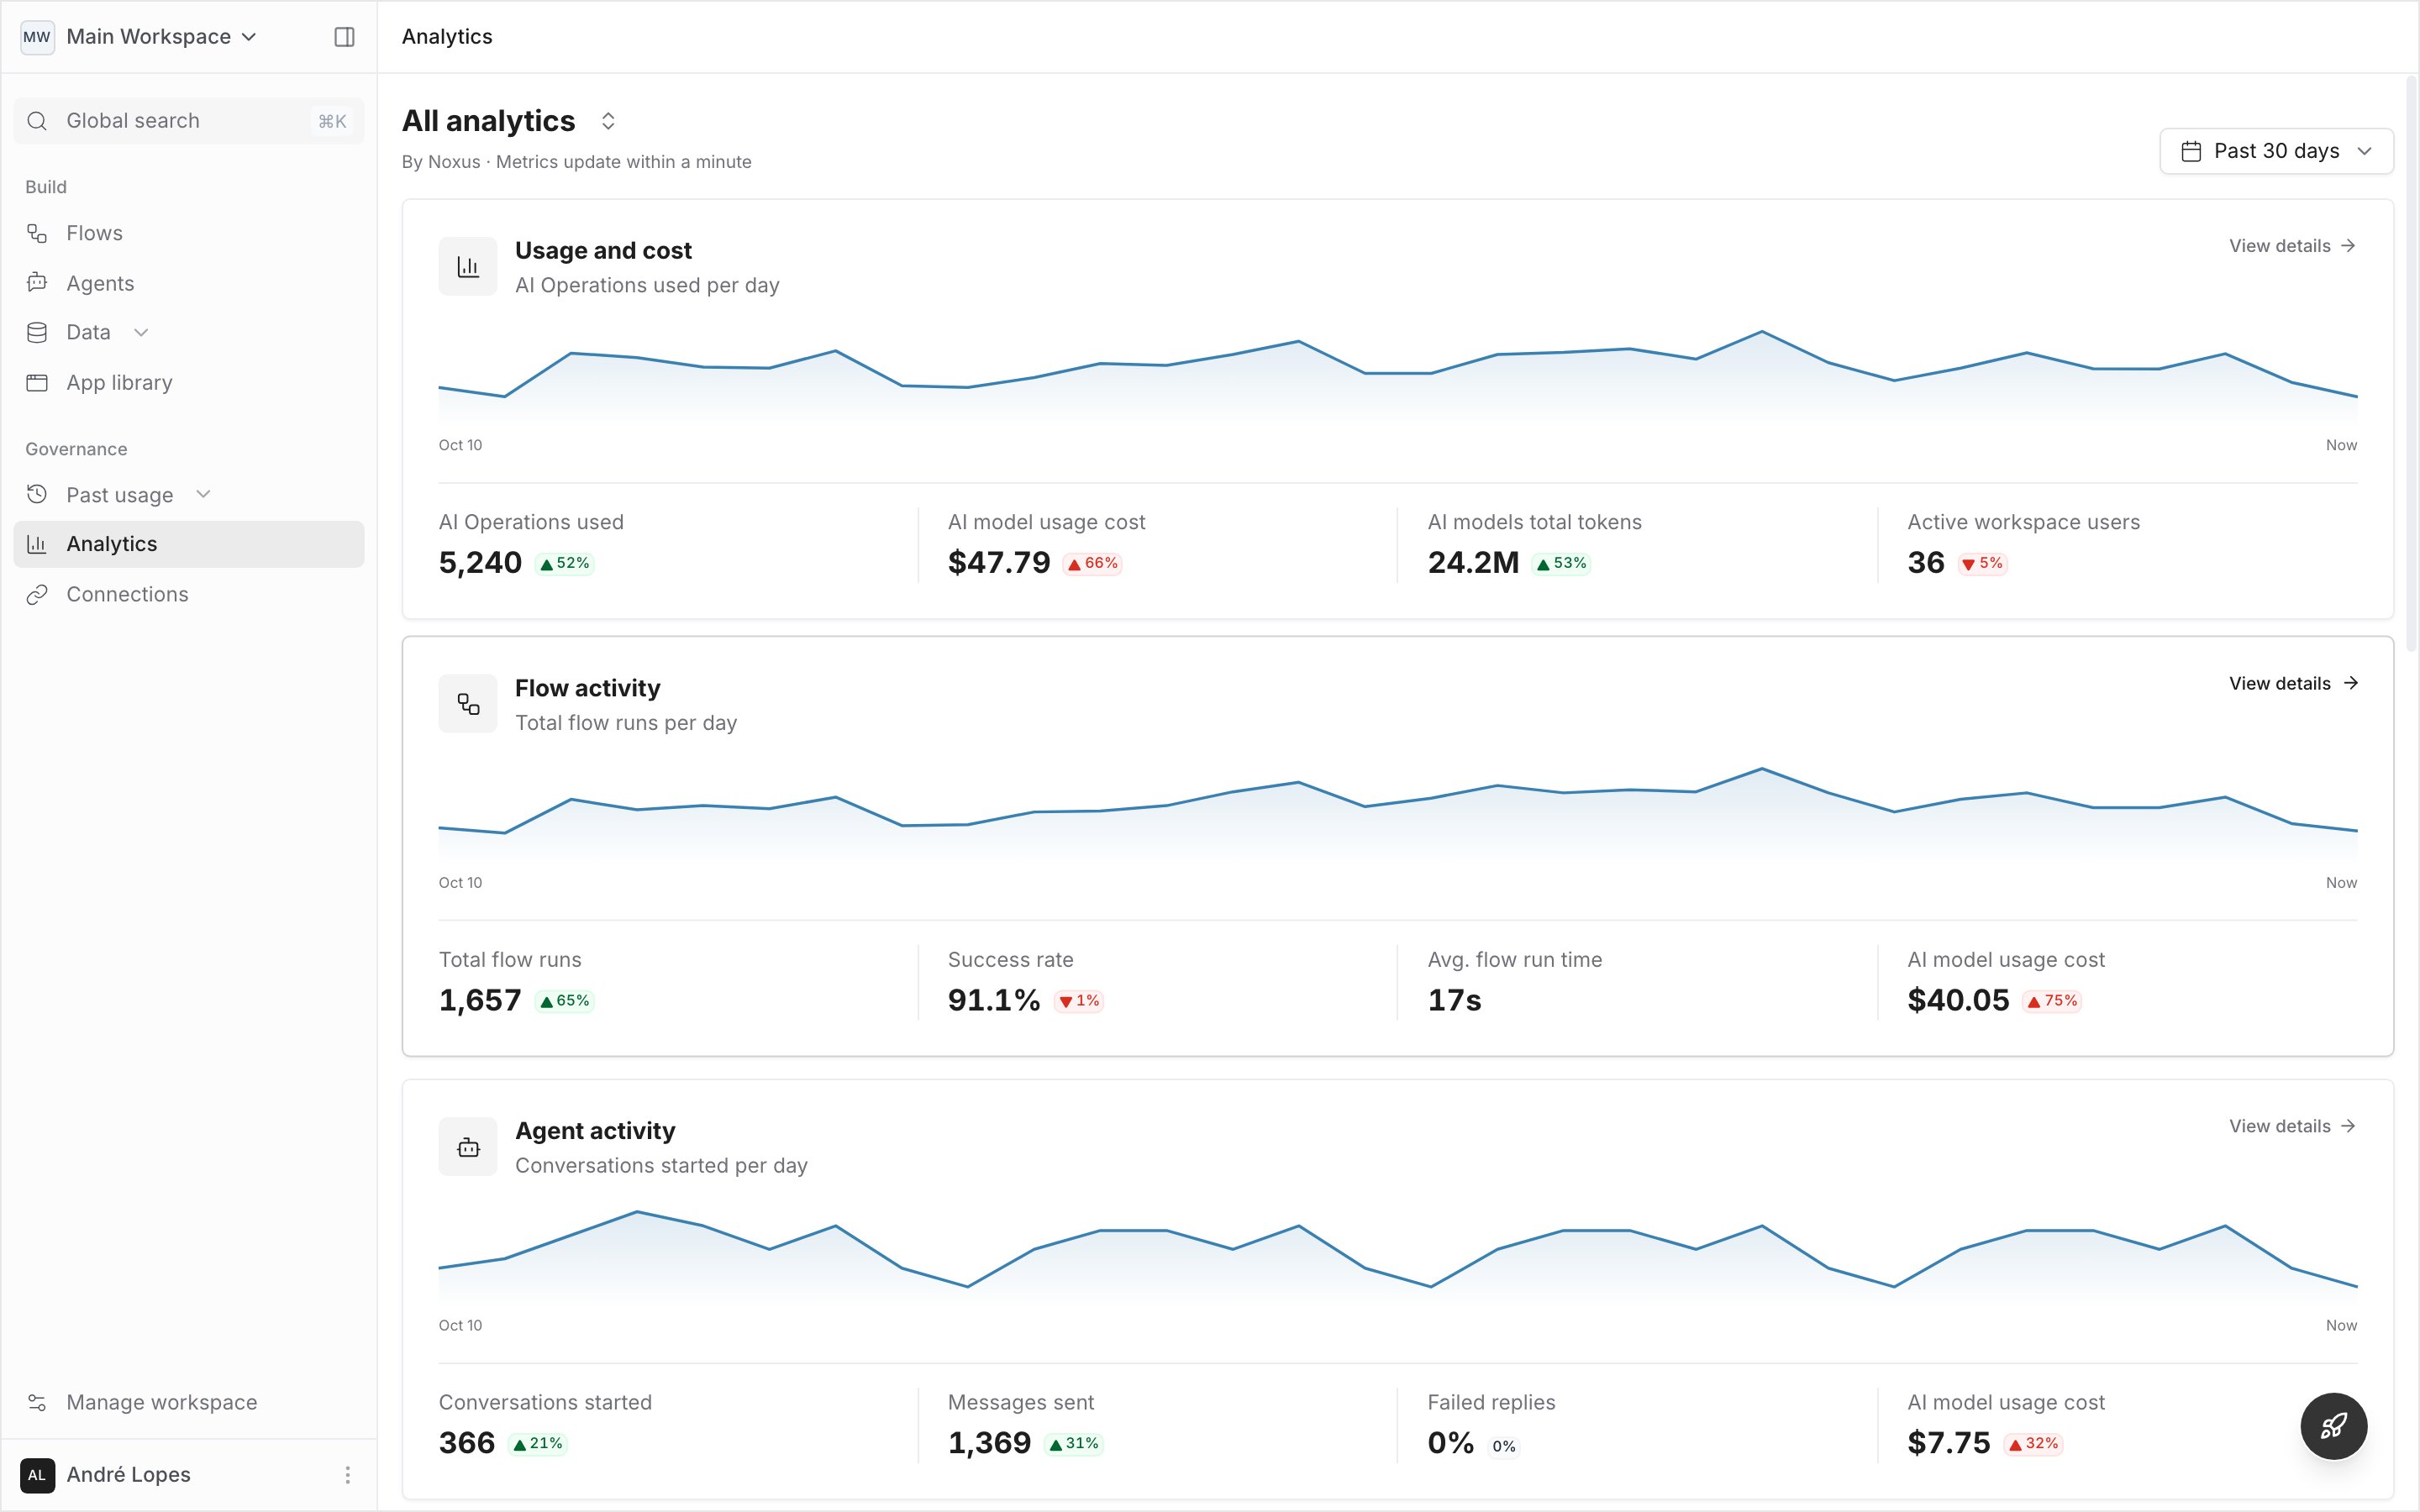
- All analytics: the page Analytics opens on. Each board is a card with the trend of its first chart and its first four numbers.
- Widget: one number, chart or table on a board. Its menu (…) exports its data as CSV. A number with an info icon links to its documentation.
- Period: the dates a board reads, such as Past 30 days or Current billing cycle. Every widget on the board follows it.
- Change: the badge beside a number compares it with the period before, in green when the change is good and red when it is bad. A drop in cost is green; a drop in runs is red.
- Filter: narrows every widget on a board to some flows, agents, users, models or other values. Each active filter shows as a chip.
- Drill-down: a click on a value in a chart or a table filters the board to it; a right click also opens that value’s own analytics.
- AI Operation: the unit your plan counts. See What counts as an AI Operation.
- AI model usage cost: what your model calls cost, in your billing currency: the tokens each call used, at the model’s catalogue rate. See Billing analytics for how it is made up.
Properties
- Automatic: every flow run, conversation, model call, API call and document upload is measured. Nothing needs to be turned on.
- Near real time: numbers update within a minute of the work that made them.
- Compared: each number shows its change against the period before, and the tooltip names that period.
- Linkable: a board’s address carries its period and filters, so a link you share opens on the same view. The period you pick is also kept while you move between boards.
- Exportable: export a board’s data as CSV from Export, or a single widget’s from its menu.
- Queryable: the widgets read the same data as the platform tables, which you can query yourself with SQL.
Permissions
What you see follows your workspace role and your organization role:My usage only ever shows your own usage. Members without View workspace analytics see no other board, card or breadcrumb.
Where you can find analytics
Analytics
Every board for the workspace: usage and cost, flows, agents, knowledge bases, the API, models and users.
In flows
A flow’s Analytics tab, and a run’s time and cost on its Metrics tab.
In agents
An agent’s Analytics tab, and the cost of a conversation and each of its messages.
In knowledge bases
A knowledge base’s Analytics tab: documents, contributors and ingestion.
Settings
Usage, Models and Users across every workspace of the organization.
REST API
Read the same metrics over the API.
Platform tables
Query runs, conversations and usage with SQL.