

All analytics
A card per board, across every workspace: Usage, Models and Users. Each card shows the trend of the board’s first chart and its first four numbers, each with its change against the period before, over the period picked on the right. Click a card, or View details, to open its board on the same period.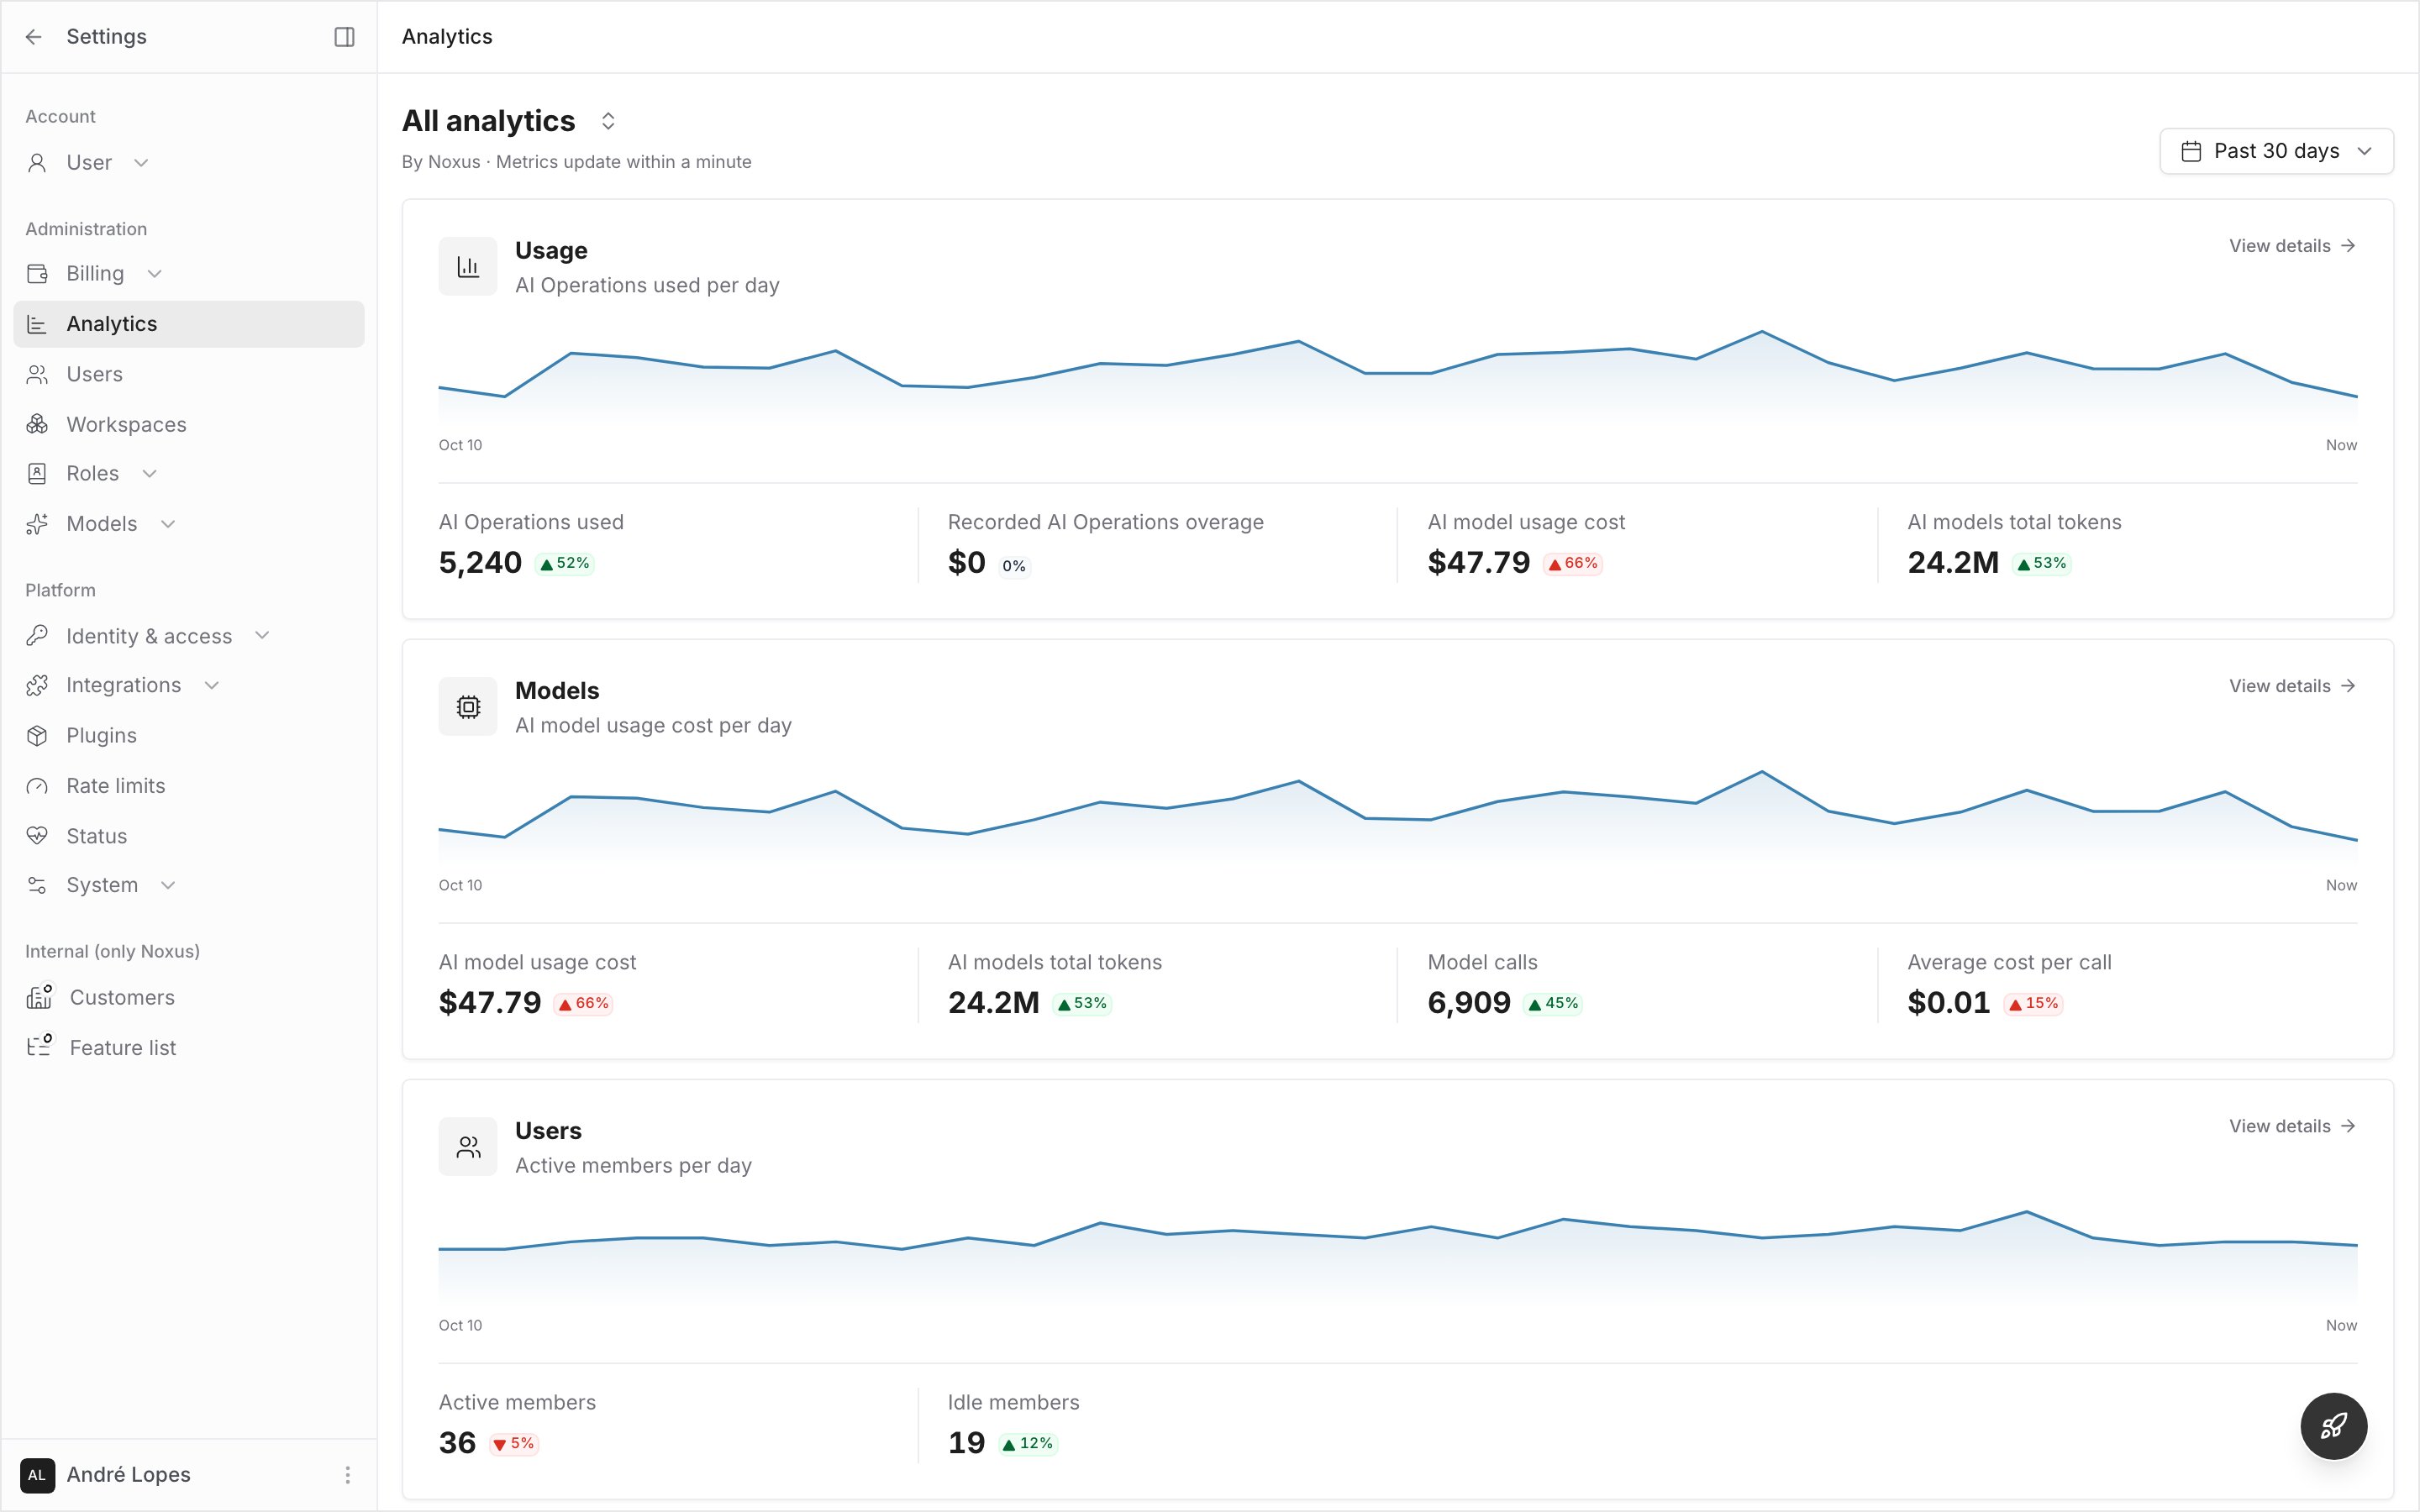
The boards
- Usage
- Models
- Users
What did the organization use, and where?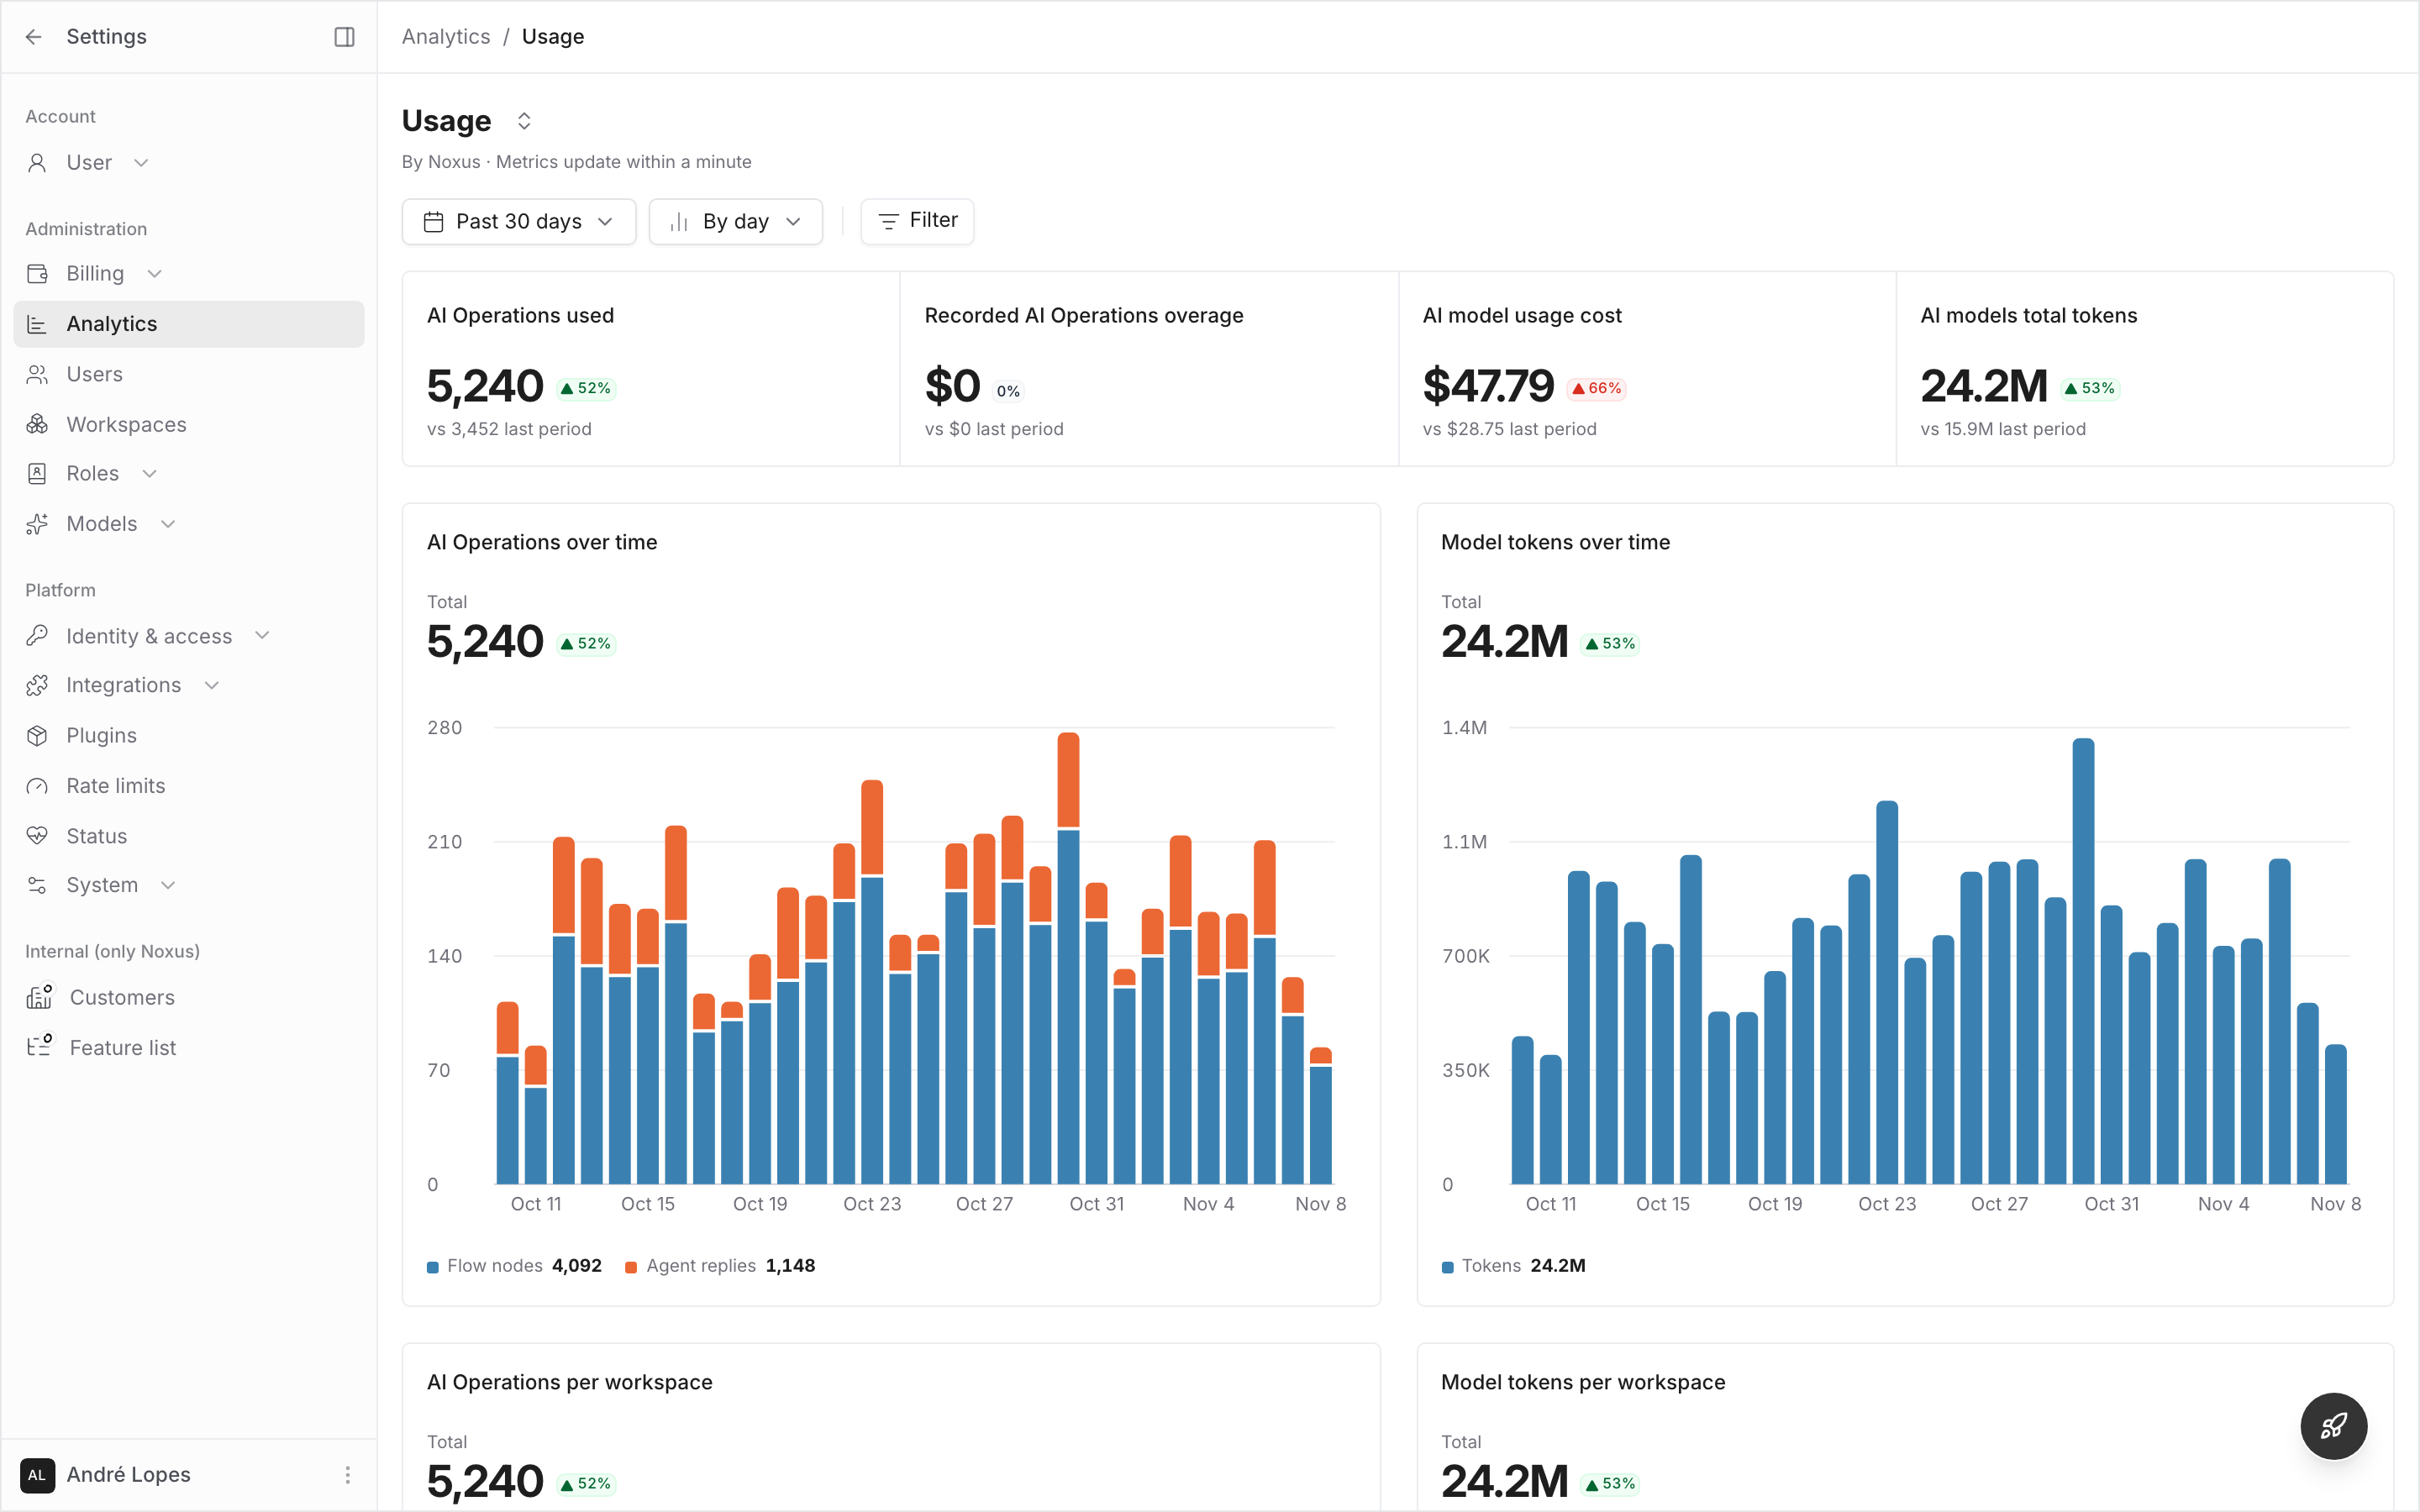
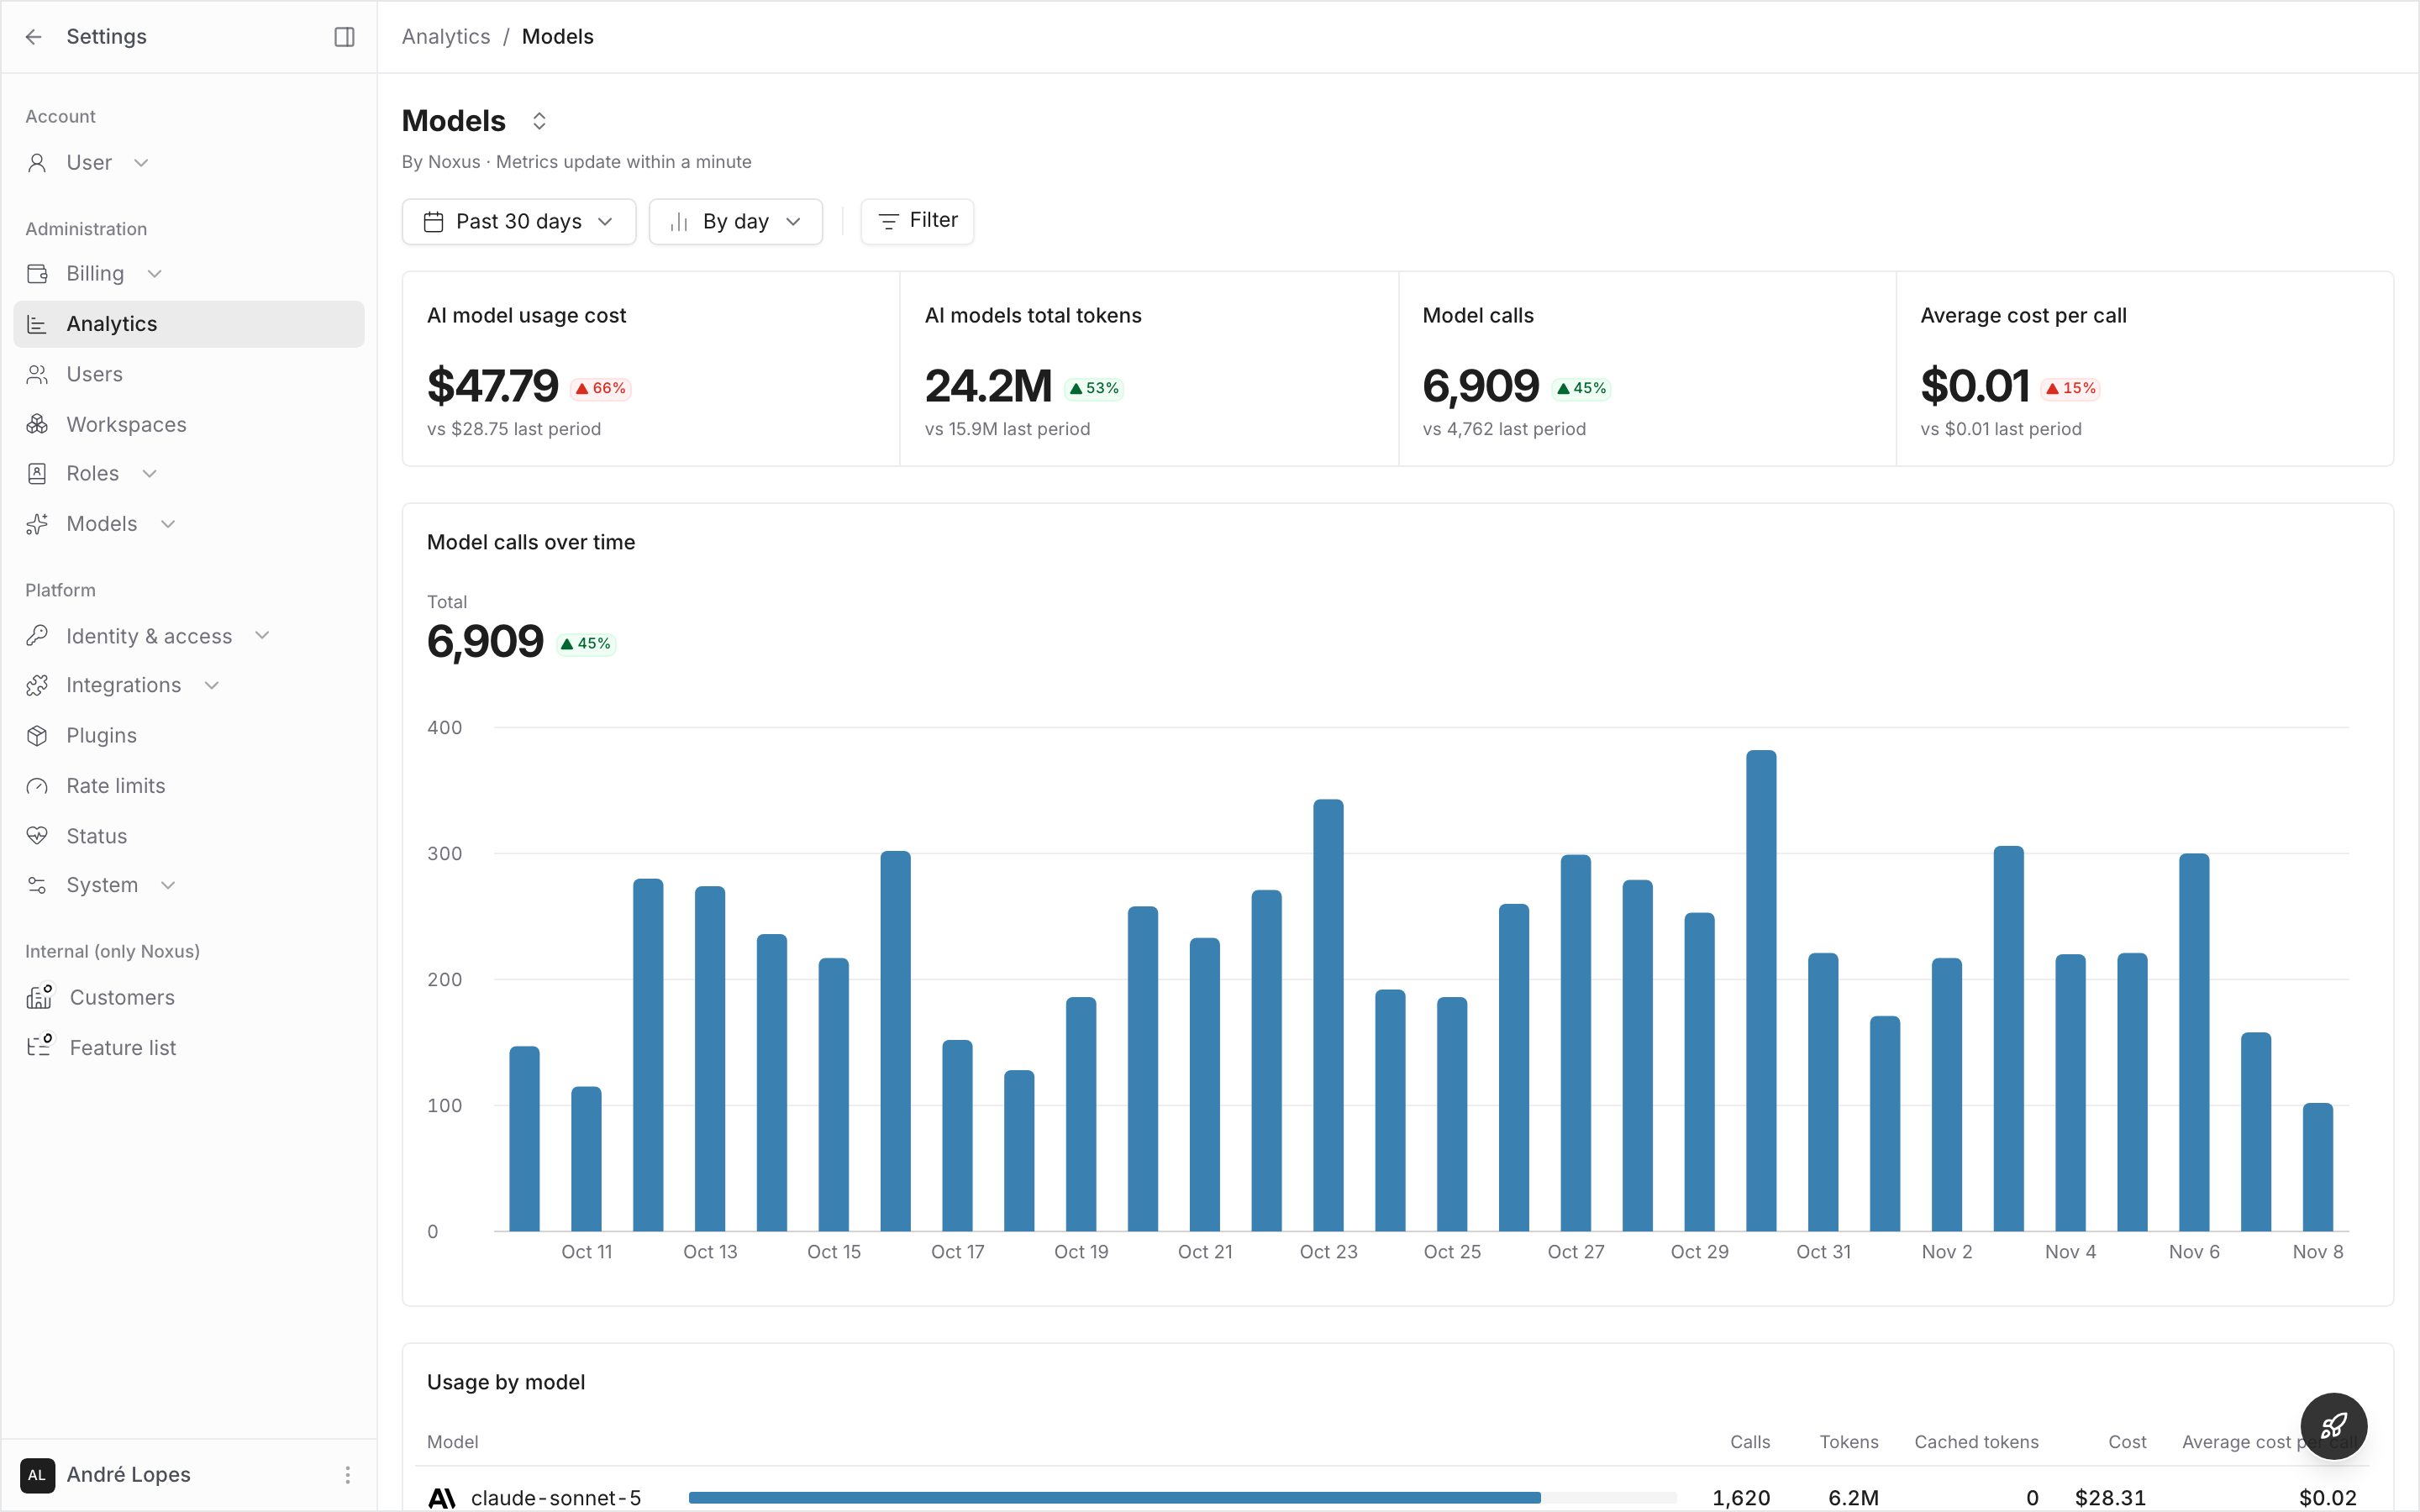
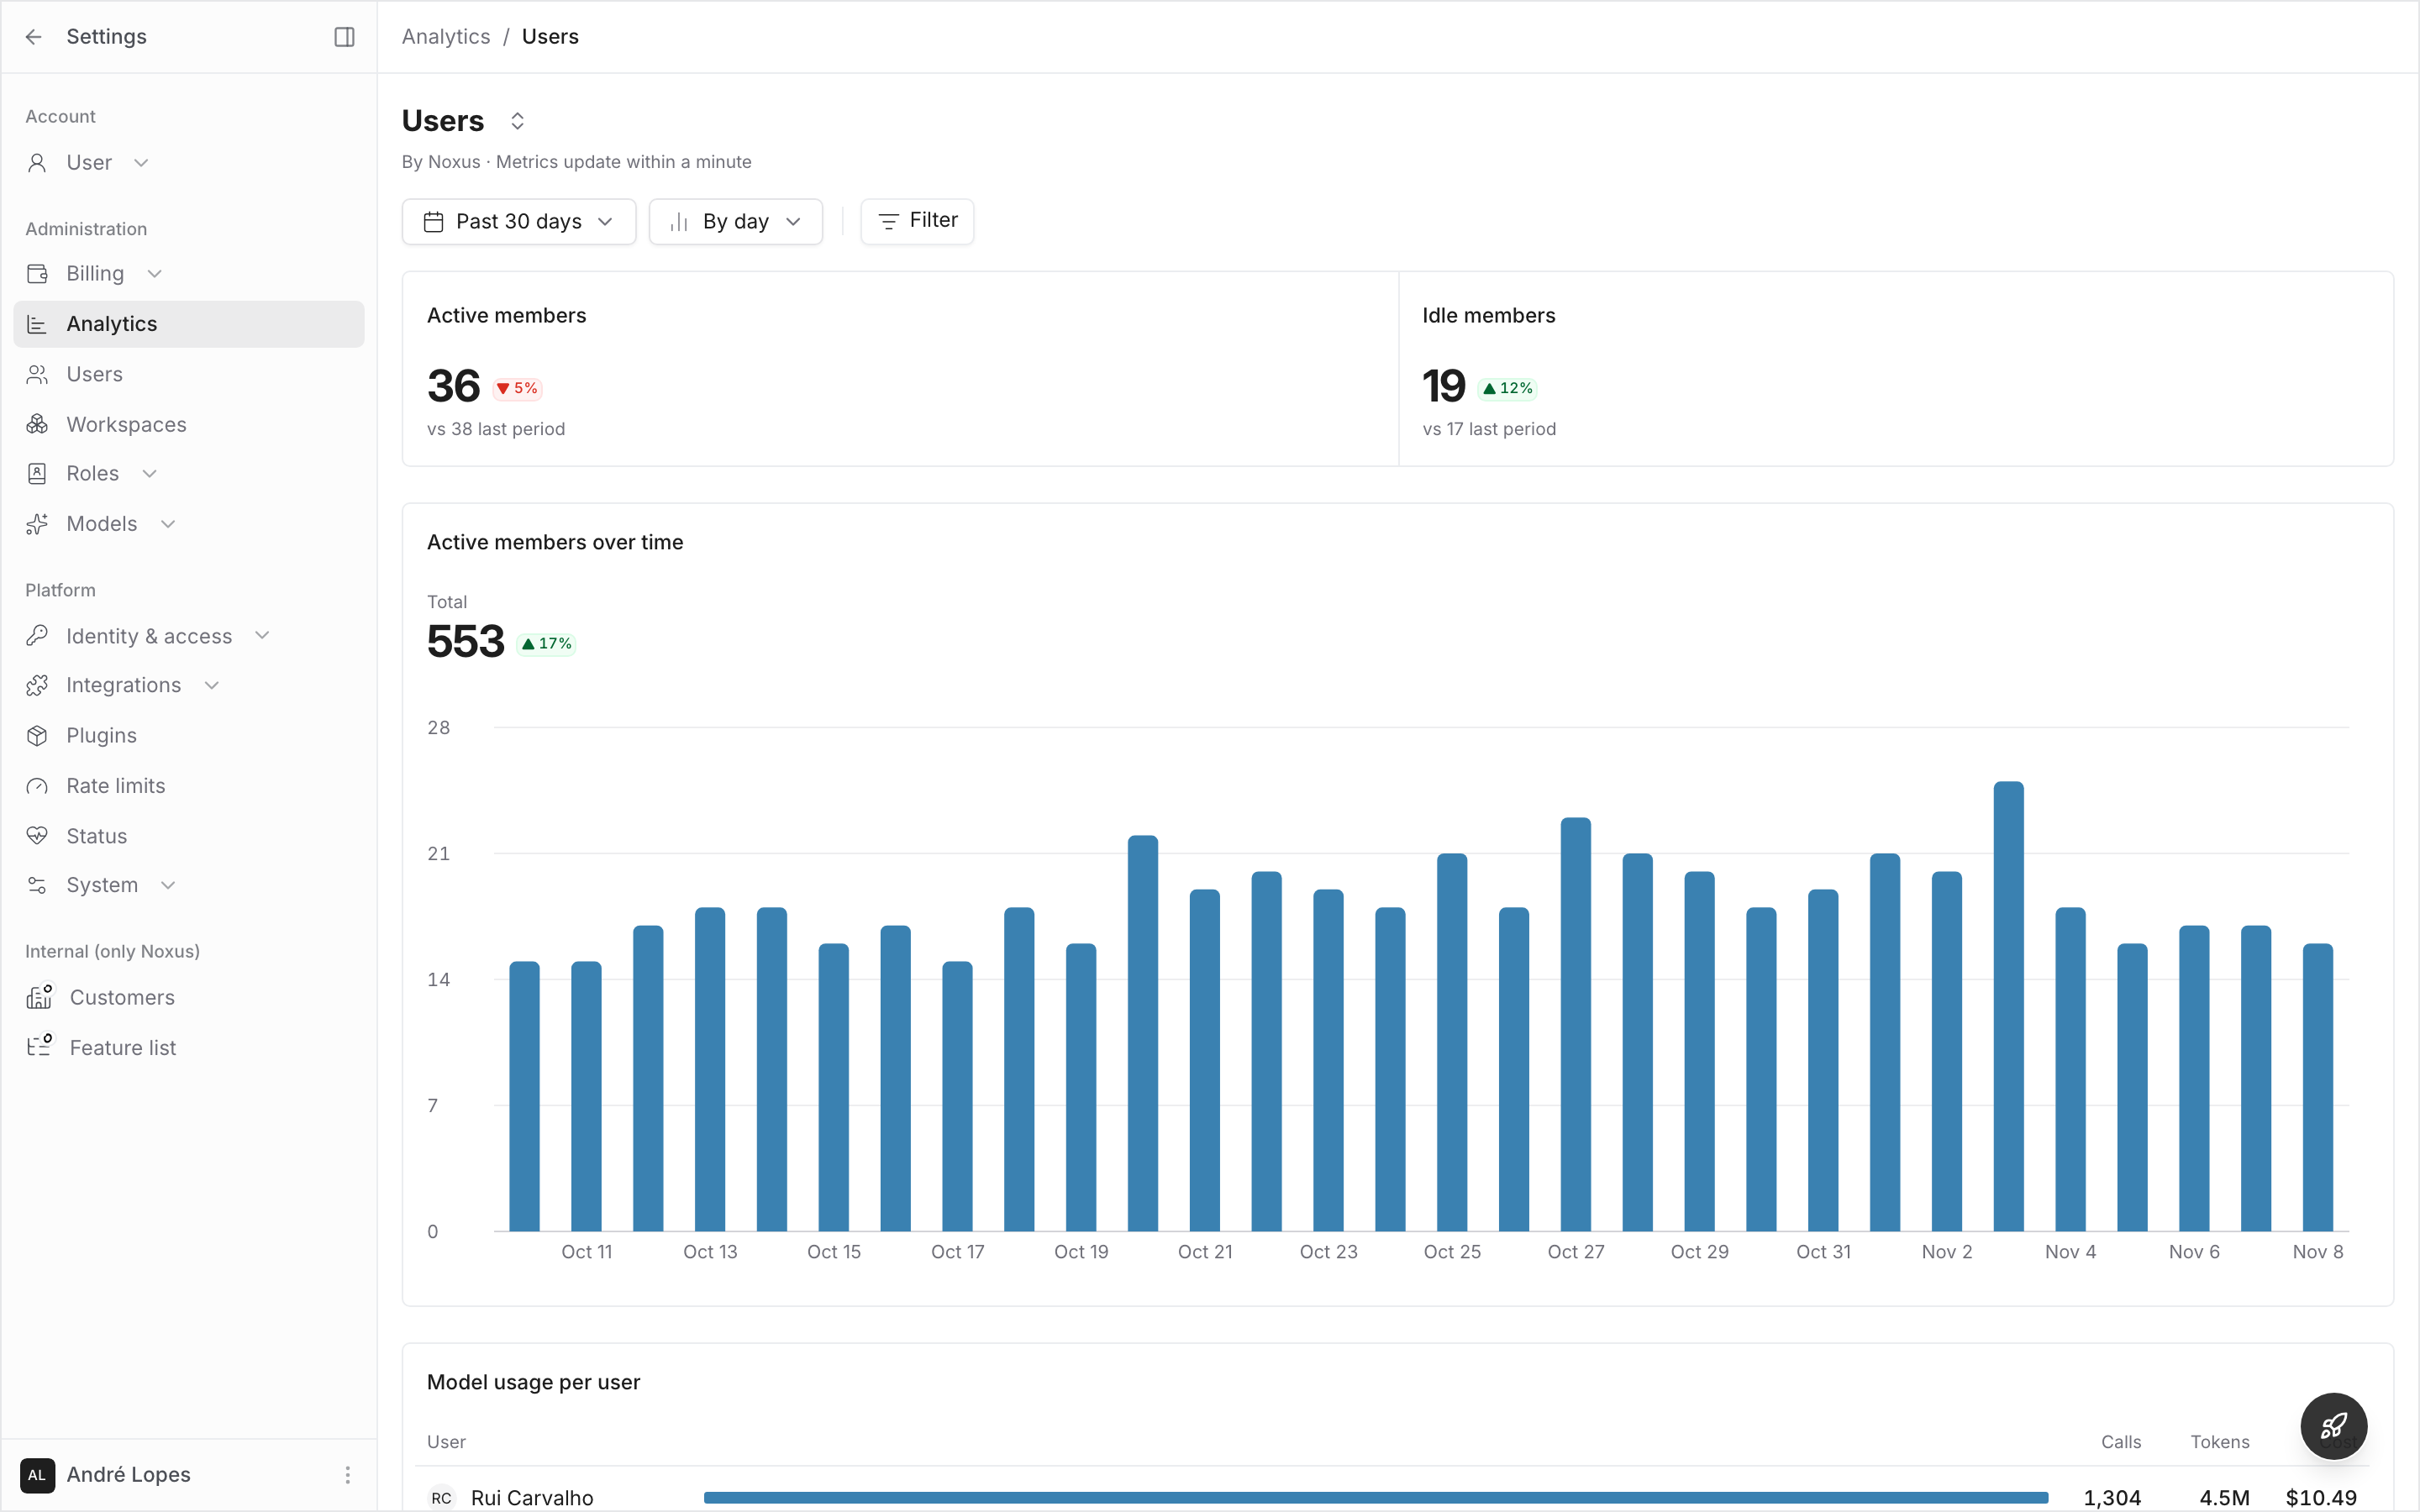
Workspaces
The boards cover every workspace until you narrow them. Pick some workspaces in the Filter menu, or click a workspace’s row or bar to add it. With every workspace, the totals include usage from workspaces that were deleted, because it still counts toward the organization’s limits. The per-workspace and per-tool charts then show a Deleted workspaces bar, so the bars add up to the totals. The bar only appears when there is such usage. The Filter menu also narrows by flow, agent, status, started by, user, channel and model, as on the workspace’s boards. See Filters and Drill-Downs.Drilling down
- Click a workspace to filter the board to it, a model to filter by it, or a flow or agent to add it to the filters.
- Right click a workspace and choose Open workspace analytics to switch to that workspace and open its Analytics, over the same period.
- Right click a flow or agent and choose Open flow analytics or Open agent analytics to open its Analytics tab, switching workspace first when it is in another one.